














BlogHow To Guides
Programmatic Measurement: KPIs From the DSP to the CRM
Every programmatic KPI list stops at the numbers the DSP reports. This guide sorts programmatic metrics by where they are true: delivery in the DSP, visits on your site, qualified leads, pipeline and revenue in the CRM. With formulas, one month worked through all three tiers, KPIs per goal, B2B and a report template.

Contents
Summarise this article with AI
Opens the page with a ready prompt in:


Nothing is sent until you pick a service.
Here is one month of a B2B software company's programmatic advertising, invented for this guide so the arithmetic can be checked. €20,000 on one DSP, split across three line items: prospecting display, native and retargeting. The DSP's report says 8,000,000 impressions at a €2.50 CPM, 5,600 clicks and 320 conversions at about €63 each. The CRM, following the same month's leads for 90 days, says 24 qualified leads, 10 opportunities worth €120,000 and 3 closed deals for €36,000: €833 per qualified lead and €6,667 per customer.
Both reports are correct. They measure different things in different systems, and nearly every article on programmatic KPIs stops at the first one: impressions, reach, frequency, viewability, CTR, CPM, video completion and the conversions the DSP's pixel counts. Those are the metrics the DSP can see. The ones a budget should follow live two systems further along, on your website and in your CRM, and no DSP dashboard shows them.
This guide sorts programmatic metrics by where they are true. It covers the delivery metrics done properly, with their formulas; the inventory that inflates them; what your site adds; how a DSP counts a conversion; the CRM metrics; which KPI to use for which goal; what changes in B2B; what only a test can answer; and a monthly report template to copy.
Quick Summary: Programmatic Measurement in One Paragraph
In short
Programmatic measurement is judging ads bought through a DSP by what they produce, from the impression to the closed deal, and the metrics are only as true as the system that records them. The DSP is the source of truth for delivery: impressions, CPM, reach, frequency, viewability, CTR and video completion. Your site is the source of truth for what happened after the click: sessions per 1,000 impressions, engaged sessions and the landing page conversion rate. The CRM is the source of truth for value: cost per qualified lead, cost per opportunity, pipeline per €1,000 spent, cost per customer and return on closed revenue. The DSP's own conversions and CPA count view-throughs and form fills inside its window, so they read cheap. Optimise the DSP on what it can see, judge the budget on the CRM tier, and use a holdout test for the one question neither can answer: what would have happened without the ads.
It is written for the people who run or approve programmatic budgets and have to defend them with numbers the sales team recognises: demand generation and performance marketers, marketing leaders at B2B and lead generation companies, and the agencies that trade on DSPs for them. If your question is how to tag DSP clicks so they arrive with a source at all, start with programmatic attribution and come back.
What Is Programmatic Measurement?
Programmatic measurement is the practice of evaluating programmatic advertising (display, native, video, audio and connected TV bought automatically through a demand-side platform) against the outcomes it produces. The outcome can be attention, a visit, a lead or a closed deal, and a complete measurement covers all of them in order, because each one depends on the one before it.
Three systems hold the evidence, and none of them holds all of it. The DSP knows what it bought: which impression, on which site, at what price, whether it was viewable and whether somebody clicked. Your website knows what arrived: the session, how long it stayed, which page it landed on and whether it filled in a form. Your CRM knows what the lead became: qualified or not, an opportunity or not, won or lost, for how much. A programmatic report that uses only the first system is a delivery report, however many metrics it lists.
The DSP's report is the right place to start and the wrong place to stop. It is precise about the things it controls and silent about the things it cannot see. Its conversion column looks like an outcome, but it is a count of pixel fires inside the DSP's own window, including people who never clicked, and it has no idea which of those conversions sales later called a fit. The rest of this guide takes the three systems one at a time and then puts them together.
The one rule of the whole discipline
Read each metric in the system that records it. Delivery in the DSP, visits on the site, value in the CRM. A metric read in the wrong system is a guess wearing a number.
The Three Tiers of Programmatic Advertising Metrics
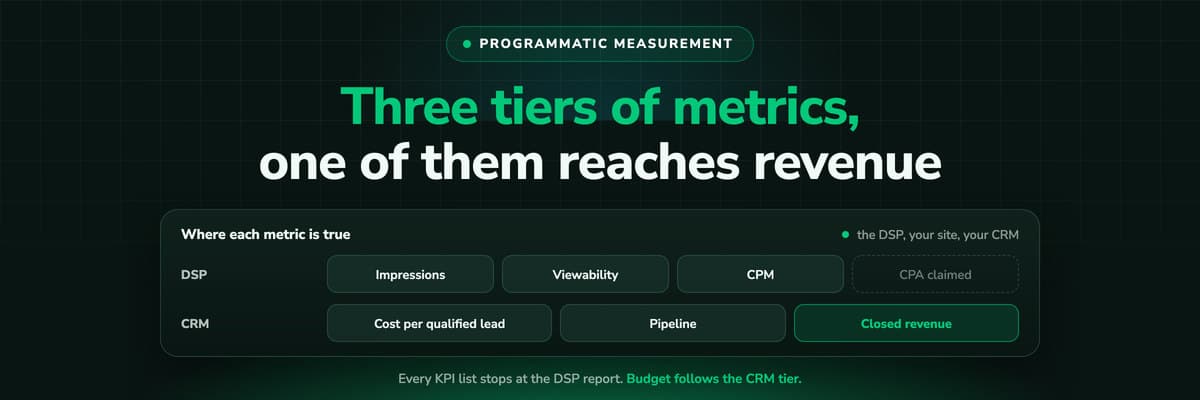
Sorting metrics by the system that records them turns a flat list of twenty acronyms into three questions asked in order: did the ads run properly, did they bring the right visitors, and did those visitors become revenue. A line item has to pass the first question before the second is worth asking, and the third is the only one that pays for anything.
Tier 1: the DSP
Delivery and exposure. Impressions, CPM, reach, frequency, viewability, CTR, video completion. True about what was bought and shown, silent about what it caused.
Tier 2: your site
What arrived. Sessions per 1,000 impressions, click to session rate, engaged sessions, landing page conversion rate. Needs clean UTMs on every click.
Tier 3: the CRM
What it was worth. Qualified leads, opportunities, pipeline, closed revenue, and the cost of each. The tier no DSP dashboard can give you.
Programmatic metrics by the system that records them
| Metric | Where it lives | What it answers | What it cannot tell you |
|---|---|---|---|
| Impressions and CPM | DSP | What was bought, at what price | Whether anyone saw or cared |
| Viewable rate | DSP or verification vendor | Whether the ad could be seen | Whether it was noticed |
| Reach and frequency | DSP | How many, how often | Who they were |
| CTR and CPC | DSP | How often an ad was clicked | Whether a person with intent clicked |
| DSP conversions and CPA | DSP pixel | What the DSP counted in its window | What it caused, or what the lead became |
| Sessions per 1,000 impressions | Site analytics | Whether clicks became visits | Whether the visitors could buy |
| Engaged rate and lead rate | Site analytics | Traffic and landing page quality | Whether the leads were buyers |
| Cost per qualified lead | CRM | Which line items produce buyers | Revenue that has not closed yet |
| Cost per opportunity, pipeline per €1,000 | CRM | The budget signal during the cycle | Whether the pipeline will close |
| Cost per customer, ROAS on closed revenue | CRM | What the spend earned | What would have closed without the ads |
The last column is the useful one. Every metric has a question it cannot answer, and the tiers are ordered so that each one answers the question the tier before it left open. The only question left open at the bottom, what would have happened anyway, belongs to a test rather than to a report, and it has a section of its own further down.
Delivery and Exposure Metrics: What the DSP Measures Well
The DSP tier is where every KPI list starts, and it deserves to be done properly rather than skipped. These metrics tell you whether the money was spent on ads that ran where you meant them to run, at a price you meant to pay, in front of people who could see them. If they fail, nothing further down the page can be trusted. Here is the illustrative month as the DSP reports it.
The month in the DSP, rounded to the euro
| Line item | Spend | Impressions | CPM | Clicks | CTR | DSP conversions | DSP CPA |
|---|---|---|---|---|---|---|---|
| Prospecting display | €10,000 | 5,000,000 | €2.00 | 2,000 | 0.04% | 80 | €125 |
| Native | €6,000 | 2,000,000 | €3.00 | 2,400 | 0.12% | 60 | €100 |
| Retargeting | €4,000 | 1,000,000 | €4.00 | 1,200 | 0.12% | 180 | €22 |
| Total | €20,000 | 8,000,000 | €2.50 | 5,600 | 0.07% | 320 | €63 |
Impressions and CPM
An impression is an ad served, not an ad seen. CPM, cost per mille, is the price of a thousand of them and the basic unit programmatic is bought in. It is a price metric, so it tells you what the inventory cost and nothing about what it did: the cheapest CPM in an account is often the cheapest for a reason. The CPM calculator runs the arithmetic in both directions.
€20,000 over 8,000,000 impressions, which is 8,000 thousands: €2.50 CPM.
Reach and frequency
Reach is the number of unique people, devices or households the DSP estimates it showed an ad to, and frequency is impressions divided by reach. In the month, prospecting reached an estimated 1,250,000 at an average frequency of 4.0, and retargeting reached 50,000 at 20. The retargeting figure is the kind worth looking at twice: twenty impressions per person in a month is where a frequency cap earns its keep. Treat reach as an estimate, because it is the DSP's view of identity across browsers and devices, not a count of people.
Viewability
The industry standard comes from the Media Rating Council: an impression is viewable when at least 50% of the ad's pixels are in view for at least one continuous second on display, and two continuous seconds on video. Large display ads of 242,500 pixels or more need 30% of their pixels in view. Google's Active View applies the same definition. The viewable rate is viewable impressions divided by measured impressions, and the more useful price is the viewable CPM: prospecting at a 62% viewable rate bought 3,100,000 viewable impressions, so its €2.00 CPM is a €3.23 viewable CPM. Viewability is a floor, not a goal. An ad that met the standard could be seen; nothing in the metric says it was.
Click-through rate and CPC
CTR is clicks divided by impressions, and CPC is spend divided by clicks. For display both are small numbers, and both are easy to misread in the same direction: a higher CTR looks like a better line item, and on programmatic inventory it is at least as often a warning. The next section explains why. The CTR calculator does the division.
5,600 clicks on 8,000,000 impressions: 0.07%. At €20,000 that is a CPC of €3.57.
Video completion rate
For video and connected TV the delivery metric that matters is completion: completed views divided by starts, reported alongside the quartiles (25%, 50%, 75%, 100%). A CTV line with 200,000 starts and 150,000 completions has a 75% completion rate. Check which denominator your DSP uses, because some divide by impressions instead of starts and the two rates are not comparable. CTV rarely produces a click at all, which is why its outcome question sits in the incrementality section rather than here.
Invalid Traffic, Made-for-Advertising Sites and Domain Lists
Every delivery metric above assumes the impressions were real and the placements were worth having. Programmatic buys across tens of thousands of sites, and two kinds of waste hide inside the averages: traffic that is not human, and sites that are human but exist to sell ad impressions rather than to be read.
The Media Rating Council's invalid traffic guidelines split the first kind in two. General invalid traffic is what lists and routine checks catch: known crawlers, spiders and similar. Sophisticated invalid traffic needs advanced analytics to find, because it is built to look like a person. DSPs document filtering of invalid traffic, and verification vendors add their own detection on top. Neither catches everything, which is one reason the site tier exists: a bot that fooled the DSP still has to behave like a buyer on your landing page and in your CRM.
The second kind is made-for-advertising inventory, sites built to maximise ad impressions per visit. The ANA's programmatic transparency study of June 2023 analysed $123 million of spend and 35.5 billion impressions, and found made-for-advertising sites took 21% of the impressions and 15% of the spend. The same study found the average campaign ran on 44,000 top-level domains. Those figures describe the study's sample of advertisers, not every account, but they explain why a domain report belongs in every programmatic review.
The working answer is a domain list: an allow list of sites you have seen perform, or at least an exclude list of the ones you have seen fail. The question is what performing means. Judged on CTR, a domain list rewards exactly the placements that manufacture clicks. Judged on the CRM, it rewards the sites whose visitors became qualified leads. That needs the domain on every click, so every lead carries it. Most DSPs have a macro that writes the site into the landing URL: [ADROLL:DOMAIN] on AdRoll, ${SOURCE_URL_ENC} on DV360 (the encoded page URL), {SA_REF_DOMAIN} on StackAdapt and %%TTD_SITE%% on The Trade Desk. The last two are documented by third parties rather than on the DSPs' public help pages, so check the macro list in your DSP before relying on them. Programmatic attribution has the full tagging convention.
Why a high CTR can be a warning
Clicks on display ads have never been spread evenly. A comScore and Starcom study from 2009 found that 8% of US internet users accounted for 85% of display ad clicks, which was the first well-known evidence that CTR measures a small, unusual group of clickers rather than the audience. Add accidental taps on small mobile screens, placements designed to be clicked by mistake and clicks that are not human, and a line item or a domain whose CTR sits far above the rest is one to investigate before one to scale.
The month shows the pattern. Native has the highest CTR in the account, 0.12%, and the cheapest click at €2.50. It also has the lowest share of clicks that became a session and the weakest engagement once they arrived, which the next section lays out. On the DSP's screen it is the second best line item; the CRM will disagree.
Site Metrics: What Happens After the Click
The site tier is where a programmatic click becomes a visit or fails to. It is also the first tier measured by a system the DSP does not control, which makes it the first honest check on the DSP's numbers. It only works if every click arrives with UTM parameters: without them, programmatic visits spread across Referral and Direct and cannot be tied back to a line item at all.
The medium you choose decides where the visits land in your analytics. GA4's default channel group puts a session in Display only when its medium is display, banner, expandable, interstitial or cpm; a medium such as programmatic, ctv or native falls into Unassigned. The DSP's macros fill the campaign, line item and creative for you. Programmatic attribution sets out the full convention and the macros, so they are not repeated here.
The month on the site, each session credited to the line item whose click brought it
| Line item | Clicks | Sessions | Per 1,000 impressions | Engaged rate | Leads | Lead rate |
|---|---|---|---|---|---|---|
| Prospecting display | 2,000 | 1,800 | 0.36 | 55% | 36 | 2.0% |
| Native | 2,400 | 1,500 | 0.75 | 20% | 20 | 1.3% |
| Retargeting | 1,200 | 1,100 | 1.10 | 60% | 24 | 2.2% |
| Total | 5,600 | 4,400 | 0.55 | 44% | 80 | 1.8% |
- Sessions per 1,000 impressionsSessions recorded on your site divided by the DSP's impressions, times 1,000. It joins the two systems without trusting the DSP's click count, and it compares line items with different CPMs on one scale.
- Click to session rateSessions divided by clicks. Prospecting kept 90% of its clicks and retargeting 92%; native kept 62.5%, 1,500 sessions from 2,400 clicks. A large gap points to accidental clicks, bots or pages that never loaded.
- Engaged sessionsGA4 counts a session as engaged when it lasts longer than 10 seconds, records a key event, or views two or more pages. Native's 20% against 55% and 60% is the same story as its click to session rate.
- Landing page conversion rateLeads divided by sessions. It measures the page as much as the traffic, so read it per landing page as well as per line item before blaming either.
By the end of the site tier the account already reads differently. Native bought the most clicks for the least money and turned them into the fewest engaged visits. Retargeting turned clicks into leads at the best rate, as it should: its audience had already visited. Prospecting sits between them on every site metric. None of this says which line item produced revenue, and that is the next two tiers' job. The landing page report is where the per page view lives in LeadJourney.
Conversions as the DSP Counts Them
The DSP's conversion column is the metric most often mistaken for an outcome. It is a count of conversion pixel fires attributed to the DSP under the DSP's own rules, and two of those rules make it read far cheaper than anything the CRM will show.
The first rule is view-through. A DSP counts a click-through conversion when somebody clicked an ad and converted inside the click window, and a view-through conversion when somebody was served an ad, did not click, and converted inside the view window. The windows are the DSP's settings: Campaign Manager 360's Floodlight is documented with 30 day click and 30 day view windows by default, adjustable up to 90, and AdRoll documents 30 days after a click and 7 after a view for retargeting. The full treatment, including when a view-through is worth counting, is in click-through vs view-through conversions, and the definition is in the glossary under view-through conversion.
The month's 320 DSP conversions, split by how the DSP counted them
| Line item | Click-through | View-through | DSP conversions | Leads on the site |
|---|---|---|---|---|
| Prospecting display | 38 | 42 | 80 | 36 |
| Native | 22 | 38 | 60 | 20 |
| Retargeting | 26 | 154 | 180 | 24 |
| Total | 86 | 234 | 320 | 80 |
In the illustrative month, 234 of the 320 conversions are view-throughs, and 154 of those sit on retargeting. That is the mechanism rather than a coincidence: a retargeting audience is made of people who already visited, many of whom were always going to come back, and at a frequency of 20 a month most of them were served an ad shortly before they came back, whatever they would have done. The view-through count credits the line item for their return. It is why retargeting's DSP CPA is €22 and prospecting's is €125.
The second rule is what counts as a conversion. The pixel fires on a thank-you page, so a DSP conversion is a form fill, not a qualified lead, and it cannot become one later: the DSP never learns what sales thought. Several DSPs accept offline conversion uploads, but within windows documented in days or weeks after the click, so a B2B deal that closes in month four is usually outside them. Even the click-through count differs from the site's: 86 against 80 leads here, because the pixel counts by its own rules and deduplicates, or not, depending on how it is set up.
None of this makes the DSP's conversions useless. They are what the DSP's bidding algorithm learns from, so they belong in the DSP and in the optimisation settings, ideally restricted to click-through where the DSP allows it. They do not belong in the budget meeting as a cost per acquisition. The attribution window entry explains why two systems counting the same lead over different windows never agree.
CRM Metrics: The Tier the Budget Should Follow
The CRM tier answers the question the programmatic budget is actually for: did the spend produce customers, and at what cost. It needs one thing the other tiers do not, the lead joined to its first click, so the qualified stage, the opportunity and the closed deal can be credited back to the line item and the domain that brought the person in. With that join, five metrics carry the tier.
- Cost per qualified leadSpend divided by the leads sales accepted as a fit. The first metric that reflects lead quality, and the fastest to arrive, usually within days of the form.
- Cost per opportunitySpend divided by the deals opened from those leads. The strongest budget signal inside a long cycle, weeks before anything closes.
- Pipeline per €1,000 spentThe value of opportunities opened, divided by spend in thousands. It weights an opportunity by its size, which a count cannot.
- Cost per customerSpend divided by closed-won deals. On media spend alone it is the programmatic share of customer acquisition cost; a full CAC adds fees, creative and the sales team.
- ROAS on closed revenueClosed revenue divided by spend. The audit metric, read on a cohort of leads once their deals have had time to close.
€20,000 and 24 qualified leads: €833 per qualified lead, against a DSP CPA of €62.50.
Here is the month's 80 leads followed through the CRM for 90 days, each credited to the line item whose click brought it.
The month in the CRM, the same 80 leads followed for 90 days
| Line item | Leads | Qualified | Opportunities | Pipeline | Closed-won | Revenue |
|---|---|---|---|---|---|---|
| Prospecting display | 36 | 14 | 6 | €78,000 | 2 | €26,000 |
| Native | 20 | 3 | 1 | €9,000 | 0 | €0 |
| Retargeting | 24 | 7 | 3 | €33,000 | 1 | €10,000 |
| Total | 80 | 24 | 10 | €120,000 | 3 | €36,000 |
Dividing the spend by each stage puts all three tiers on one row per line item. Every figure is the spend divided by the count above, rounded to the euro; the last column is revenue divided by spend.
The DSP's CPA against the CRM's costs, computed from the tables above
| Line item | DSP CPA | Cost per lead | Cost per qualified lead | Cost per opportunity | Cost per customer | ROAS |
|---|---|---|---|---|---|---|
| Prospecting display | €125 | €278 | €714 | €1,667 | €5,000 | 2.6x |
| Native | €100 | €300 | €2,000 | €6,000 | No customer | 0.0x |
| Retargeting | €22 | €167 | €571 | €1,333 | €4,000 | 2.5x |
| Total | €63 | €250 | €833 | €2,000 | €6,667 | 1.8x |
Read the columns from left to right and the cost of a result multiplies at every stage: €63 per DSP conversion, €833 per qualified lead, €6,667 per customer, more than a hundred times the DSP's figure. That is not the DSP being wrong. It is the DSP answering a smaller question. The ranking changes too. The DSP says retargeting is more than five times cheaper than prospecting; the CRM says it costs €4,000 per customer against €5,000, nearly level, and the incrementality section asks how many of retargeting's customers were coming anyway. Native, the DSP's second best line item on CPA, produced three qualified leads, one opportunity and no customer: €2,000 per qualified lead and €1,500 of pipeline per €1,000 spent, against €7,800 on prospecting.
Two reading rules keep the tier honest. Read pipeline weekly and closed revenue as a cohort: the month's leads, followed until their deals have had time to close, rather than this month's revenue divided by this month's spend. And keep the definitions in the glossary so the whole team uses the same ones: cost per lead, qualified lead, customer acquisition cost and return on ad spend. The ROAS calculator and the true cost per lead work the arithmetic for a single channel, and long sales cycle attribution covers what to do while the cohort is still closing.
Which Programmatic KPIs for Which Goal
Every line item needs two KPIs, and mixing them up is the most common mistake in programmatic reporting. The first is the one you optimise the DSP on: it has to be something the DSP can see, or its bidding has nothing to learn from. The second is the one you judge the budget on: it has to be something the business cares about, which the DSP usually cannot see. A retargeting line optimised and judged on the same DSP CPA will always look like the best thing in the account.
Two KPIs per programmatic goal
| Goal | Optimise the DSP on | Judge the budget on |
|---|---|---|
| Awareness | Viewable reach at a capped frequency, viewable CPM | A lift test; branded search and direct leads during the flight as a hint, not a proof |
| Prospecting | Click-through conversions, where the DSP allows it | Cost per qualified lead and pipeline per €1,000 |
| Retargeting | Click-through conversions under a frequency cap | Cost per opportunity, then a holdout test |
| Native | Click-through conversions, excluding domains with poor sessions per click | Cost per qualified lead by domain |
| B2B demand generation | Click-through conversions on the target account list | Cost per opportunity and closed revenue on the list |
| CTV and online video | Completion rate and household reach | A geo holdout, because CTV rarely produces a click |
The pattern in the right hand column is that every goal except awareness ends in the CRM, and awareness ends in a test. No row ends in a DSP metric, because a DSP metric can tell you the line item ran well and never that it was worth the money. The left hand column still matters: a line item optimised on the wrong DSP signal buys the wrong impressions, and no amount of CRM reporting fixes that after the fact.
If you run programmatic next to Meta, Google and LinkedIn, judge them on the same right hand column. A cost per qualified lead is comparable across channels in a way a DSP CPA and a Meta CPA never are, because the CRM counts both with one definition. Lead quality by channel is that report for every source at once.
How to Measure B2B Programmatic Advertising
B2B programmatic buys against companies rather than people: a target account list, firmographic segments, intent data. The DSPs and account-based platforms that sell it report at the account level too, with metrics such as accounts reached, account engagement scores and pipeline on the accounts that were served ads, often called influenced pipeline. The B2B Stack's 2026 guide to B2B programmatic states the gap plainly: "The DSP will happily report impressions, clicks, CTR, viewability, and CPM. It will not tell you which target accounts are more engaged this month than last, which have moved from cold to research stage, or which are showing buying-committee patterns."
Account metrics are a real improvement on impressions. They tell you whether the list is being reached and whether anyone at those companies is responding. What they do not do is attribute, and the word influenced is where the two get confused. An influenced pipeline figure counts the opportunities on accounts that were exposed within a window. It does not say the ads caused them, for three reasons.
- The list was chosen to convert. Target accounts are picked because they fit and look in market, so they open opportunities at a higher rate with or without ads. Exposure and pipeline then correlate by design.
- Exposure is nearly universal. At a CPM of a few euros, serving every account on a list of a few thousand is cheap, so almost every opportunity on the list was reached, and influenced drifts toward meaning opened.
- Every channel claims the same deal. LinkedIn, the DSP and the events team can each report the same opportunity as influenced, so influenced pipeline summed across channels is larger than the pipeline.
A lead-level CRM view adds the facts influence cannot: which named people arrived through a programmatic click, which line item and domain brought them, what stage each reached and what it closed for. That gives the B2B programmatic budget the same cost per opportunity and pipeline per €1,000 as the rest of the account, instead of a separate influence number nobody can compare with anything. Its limit is the anonymous colleague who saw the ad and never clicked, which only an account-level tool or a test can speak to. The B2B marketing attribution guide sets out when lead-level is enough and when a buying committee needs account-level tracking.
A B2B programmatic measurement plan in four steps
- Hold out part of the target list. Split the accounts at random and keep a share out of the programmatic line items for a full sales cycle. Comparing opportunity rates between the two halves is the honest version of influenced pipeline.
- Tag every click with the line item and the domain. UTMs filled by the DSP's macros, so every lead carries its source into the CRM from the first visit.
- Follow every lead through the CRM stages. Qualified, opportunity and closed-won, with the deal amount, credited back to the click.
- Report cost per opportunity and pipeline per €1,000 per line item, with account reach and engagement beside them as context rather than as the result.
Incrementality: What Only a Test Can Answer
Every tier above measures what happened to people who saw or clicked an ad. None of them measures what those people would have done without it, and that difference is the only thing the budget really buys. Nothing about the month's three customers, two through prospecting and one through retargeting, says how many would have closed anyway. Only an experiment can: a group that could have been served the ads and was not.
Audience holdout
A random share of the audience is kept from the ads. Compare conversion rates between the served group and the held-out group over the same period.
Geo split
Matched regions with the campaign on and off. It works for CTV and other media with no click, and the outcome side is a CRM report by region.
Conversion lift study
Some DSPs and publishers run lift studies for you. Ask how the control group is built and what outcome is measured before trusting the result.
The case for testing is not theoretical. Gordon, Zettelmeyer, Bhargava and Chapsky compared observational estimates of ad effects with the results of 15 randomised US advertising experiments at Facebook, published in Marketing Science in 2019, and found the observational methods often failed to reproduce what the experiments measured, even with extensive demographic and behavioural controls. Attribution, however good, is an observational method.
The limit is volume. The natural variation in a count is roughly its square root, so a test needs enough outcomes in each group for a real difference to stand out. The illustrative month has 24 qualified leads; split in half, that is about 12 per group, and a genuine 20% effect is a difference of two or three leads, well inside the noise. A test on closed deals would need far more. The practical answer for a smaller account is to test on the highest volume outcome that still means something, qualified leads or opportunities rather than closed deals, to run the test for longer, and to test the line item where the doubt is largest, which is almost always retargeting.
Tests and attribution answer different questions
Attribution says which line item a customer came through. A test says how many customers a line item added. You need the first every week and the second a few times a year.
Programmatic Campaign Tracking to the Closed Deal with LeadJourney
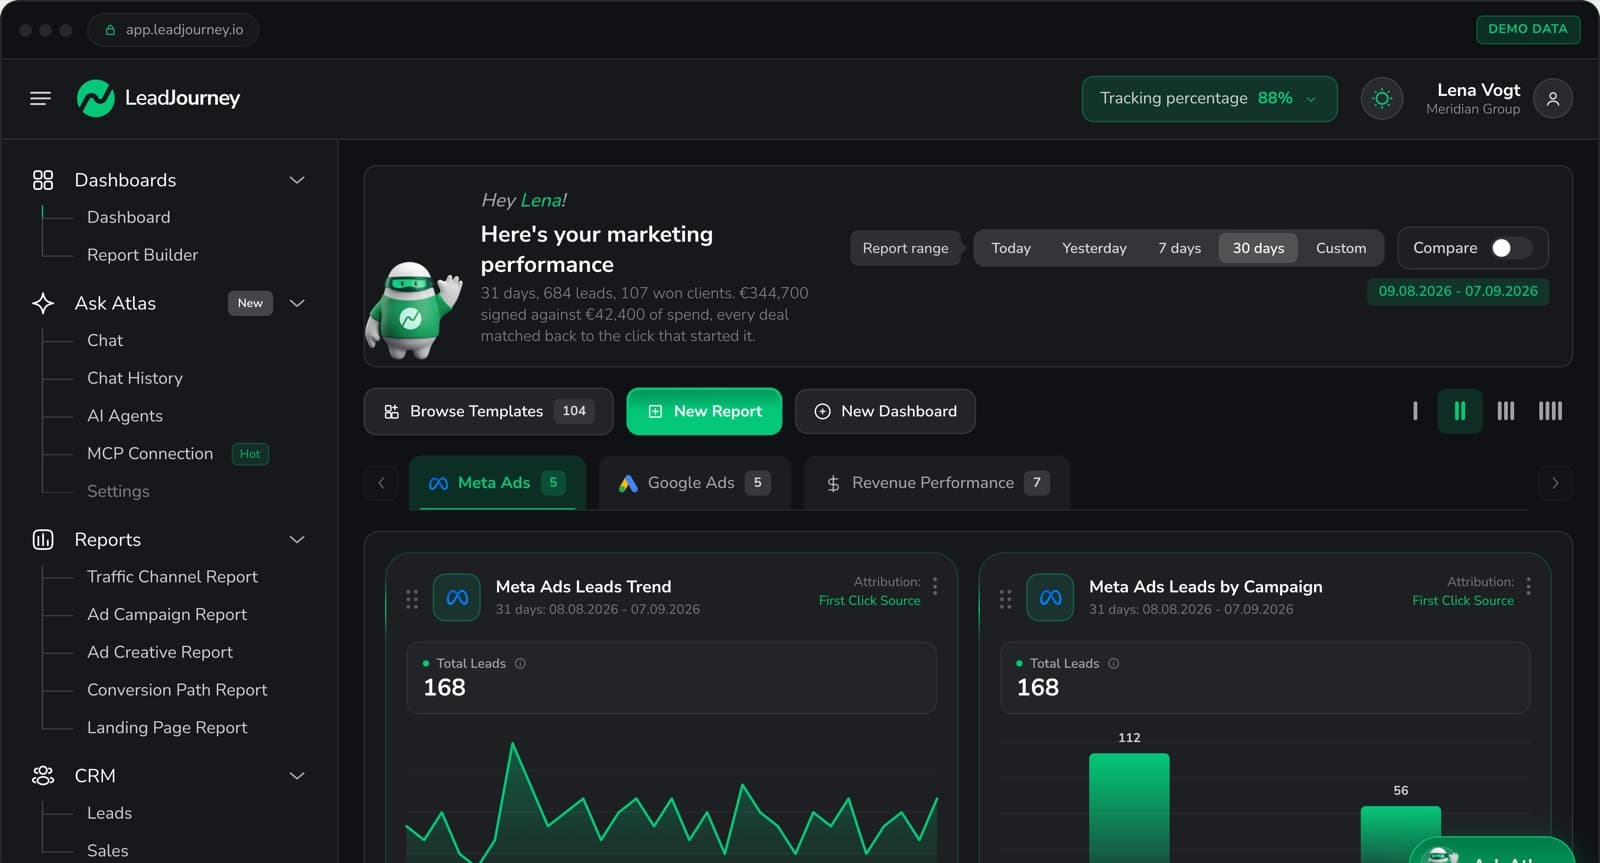
LeadJourney is an all-in-one attribution platform for lead generation, B2B SaaS, e-commerce and agencies, and for programmatic it supplies the second and third tiers. The DSP's clicks land with UTMs filled by the DSP's macros, and the DSP becomes a custom traffic channel of its own, named however you like ("StackAdapt" or "The Trade Desk"), with its spend entered by hand as a channel cost, once or per month. From there it reports leads, cost per lead, pipeline and closed revenue in the traffic channel report, next to Meta, Google, LinkedIn and Microsoft, under first click, last click, linear, position-based or time decay, switchable on the report without re-tracking.
Underneath, tracking runs server-side on your own domain at 95%+ accuracy. The UTMs, the referrer and the landing page are stored first-party at the first visit on the LeadJourney Click ID, kept for weeks or months, so a lead who clicked a native ad in March and booked a demo in May still carries the line item. At the form, the call or the booking the visitor becomes a lead, the source is written onto the lead in your CRM, and the record follows the CRM stages to the closed deal: natively on HubSpot, Salesforce, Pipedrive, Close, Attio, GoHighLevel, ActiveCampaign, Odoo, Zoho and Dynamics, and through a webhook, Zapier, Make, n8n or the API on anything else. If the DSP's domain macro fills one of the UTM parameters, the domain travels on every lead as well, which is what a domain list judged on qualified leads needs. Every recorded click is in the logs, and each lead's touchpoints are in the journey view.
The limits, in the same section. LeadJourney does not connect to The Trade Desk, StackAdapt or DV360 today; the clicks arrive through UTMs and the spend is entered as a channel cost. It does not import impressions, viewability, reach or frequency, so the DSP tier stays in the DSP. It records clicks, not views, so it gives no view-through or impression credit and sees no CTV influence without a click. It does not identify companies or report account-level influenced pipeline, and it does not run holdout, geo or lift tests. It sends nothing back to a DSP; CRM stages go back as conversions with the deal value to Meta, Google, LinkedIn and Microsoft only. Its numbers will differ from the DSP's, because it counts leads and deals where the DSP counts pixel fires.
What it gives a programmatic budget is the right hand column of the KPI table: cost per qualified lead, pipeline, cost per customer and closed revenue for the channel and for each campaign its UTMs carry, on the same definitions as every other channel. Setup takes about 21 minutes and the trial runs 14 days with no credit card. Plans start at €129 a month; custom traffic channels and their costs are included from the Starter plan (€249 a month), not on Launch. The reports are clickable on demo data in the live demo.
How to Measure Programmatic Advertising: A Monthly Report Template
A programmatic report that follows the three tiers fits on one page. Each row is a metric per line item, with this month and last month side by side; the order is the order the questions depend on each other, so a failure near the top explains the rows beneath it. Copy the rows, fill them from the system named in the second column, and read the fourth column as the decision the row informs.
One page, thirteen rows, per line item
| Row | Where it comes from | Tier | Read it for |
|---|---|---|---|
| Spend, impressions, CPM | DSP | Delivery | Pacing and price |
| Viewable rate, viewable CPM | DSP or verification vendor | Delivery | Whether the ads could be seen |
| Reach, average frequency | DSP | Delivery | Saturation and frequency caps |
| Top domains by spend | DSP site report | Delivery | Made-for-advertising sites and waste |
| Clicks, CTR, click to session rate | DSP and site | Site | Accidental clicks and bots |
| Sessions per 1,000 impressions, engaged rate | Analytics or attribution tool | Site | Traffic quality per line item |
| Leads, lead rate | Attribution tool | Site | Landing page performance |
| DSP conversions, click and view split | DSP | Delivery | What the DSP is learning from |
| Qualified leads, cost per qualified lead | CRM | CRM | Lead quality per line item |
| Opportunities, pipeline per €1,000 | CRM | CRM | The budget signal during the cycle |
| Closed revenue, cost per customer, ROAS | CRM, lagged cohort | CRM | The audit |
| Qualified leads and customers by domain | CRM with the domain UTM | CRM | The allow and exclude lists |
| Test status | Holdout or geo test | Test | What the line item added |
Three habits make the template work. Put the DSP CPA and the cost per qualified lead in adjacent columns, so the gap between them is seen every month rather than discovered once. Read the closed revenue row on the cohort of leads from two or three months ago, matched to your sales cycle, not on this month's leads. And change budgets on the CRM rows and settings on the DSP rows: a frequency cap is a DSP decision, a budget shift between line items is a CRM decision. For the agency version of this page, agency client reporting shows it as a client dashboard, and cross-platform reporting puts programmatic beside every other channel.
Further Reading
The rest of the programmatic cluster: programmatic attribution for the tagging convention and the macros, click-through vs view-through conversions for which conversions to count, and the glossary entries for view-through conversion and attribution window. The B2B side: B2B marketing attribution, long sales cycle attribution and the B2B buyer journey. Why the platforms and the CRM disagree: GA4, Meta and Google conversions against the CRM.
The definitions: qualified lead, revenue attribution, cost per lead, customer acquisition cost and return on ad spend. On the product side: custom traffic channels, UTM and click ID tracking, lead quality by channel and proving marketing ROI. The calculators: CPM, CTR, ROAS and CAC.
FAQ
Frequently Asked Questions
What marketers ask when a programmatic report has to hold up in a budget meeting.
What is programmatic measurement?
Programmatic measurement is the practice of evaluating ads bought through a demand-side platform (display, native, video, audio and connected TV) against the outcomes they produce, from the impression to the closed deal. The evidence sits in three systems. The DSP records delivery and exposure: impressions, CPM, reach, frequency, viewability, CTR and video completion. Your website records what happened after the click: sessions, engagement and landing page conversions. Your CRM records what the leads became: qualified leads, opportunities, pipeline and closed revenue. A complete measurement reads each metric in the system that records it and judges the budget on the CRM tier.
Which KPIs matter most in programmatic advertising?
It depends on whether you are steering the DSP or judging the budget, and each line item needs one of each. To optimise the DSP, use what it can see: viewable reach and viewable CPM for awareness, click-through conversions for prospecting and retargeting, completion rate for video and CTV. To judge the budget, use what the business cares about: cost per qualified lead, cost per opportunity, pipeline per €1,000 spent and, once deals have closed, cost per customer and return on closed revenue. For awareness and CTV, where clicks are rare, the budget question is answered by a holdout or geo test rather than a report.
What is a good CTR or viewability rate for programmatic ads?
There is no single good number, because both vary with the format, the placement, the device and the audience, and the benchmarks in circulation are mostly vendor figures drawn from their own accounts. Viewability has a standard definition from the Media Rating Council (at least 50% of the pixels in view for one continuous second on display, two on video), so compare viewable rates across your own line items and over time. Display click-through rates are usually well under one percent. A CTR far above the rest of your account is worth investigating before scaling, because accidental clicks, clicks designed into a placement and bots all raise it. Judge a line item on what its clicks became in the CRM.
How do you measure programmatic ROI?
Divide the revenue your CRM closed from programmatic leads by what the programmatic line items cost. That needs three things: UTMs filled by the DSP's macros on every click, so each lead carries its line item; the lead joined to its CRM deal, so the closed amount can be credited back; and the spend per line item from the DSP. Read it on a cohort of leads, followed until their deals have had time to close, rather than this month's revenue over this month's spend. During a long cycle, cost per opportunity and pipeline per €1,000 spent are the earlier signals. The DSP's own ROAS, built on its pixel conversions and view-throughs, is not the same measure.
How do you measure B2B programmatic advertising?
In two layers. B2B DSPs and account-based platforms report account reach, account engagement and influenced pipeline, which show whether the target list is being reached and is responding. Influence is not attribution: target accounts were chosen because they are likely to buy, nearly all of them are exposed, and every channel claims the same opportunity. So add a lead-level CRM view, which shows which named people arrived through a programmatic click, what stage they reached and what they closed for, giving cost per opportunity and pipeline per €1,000 per line item. For the causal question, hold out a random share of the target accounts for a full sales cycle and compare opportunity rates.
Why does the DSP's CPA not match the CRM?
Because they count different things. The DSP counts conversion pixel fires attributed to it under its own rules, including view-through conversions from people who were served an ad and never clicked, inside windows the DSP sets. It counts a form fill, not a qualified lead, and never learns what sales decided. The CRM counts leads that became qualified leads, opportunities and closed deals, usually far fewer and later. In the example in this guide the DSP reports €63 per conversion and the CRM €833 per qualified lead. The two will not agree and are not meant to: use the DSP's figure to steer the DSP and the CRM's figure to decide the budget.
Keep reading
More from the blog
 How To Guides
Reddit Conversion Tracking: Pixel, CAPI and CRM Events
Reddit reports what the Pixel and the Conversions API tell it, inside the windows set on your account. What to count for lead generation and for a store, how the two sources deduplicate on one conversion ID, what a CRM stage can and cannot do in Reddit, how to verify it in Events Manager, and which number deserves the budget.Read the article20 min read How To Guides
Reddit Pixel Setup: GTM, Shopify, Base Code and Events
Every way to install the Reddit Pixel, with Reddit's own steps and code: the base code, Google Tag Manager two ways, the Shopify app or a custom pixel, WooCommerce. Then the eight standard events, custom events and metadata, first-party cookies and consent, and how to check it all with the Pixel Helper and Event Testing.Read the article22 min read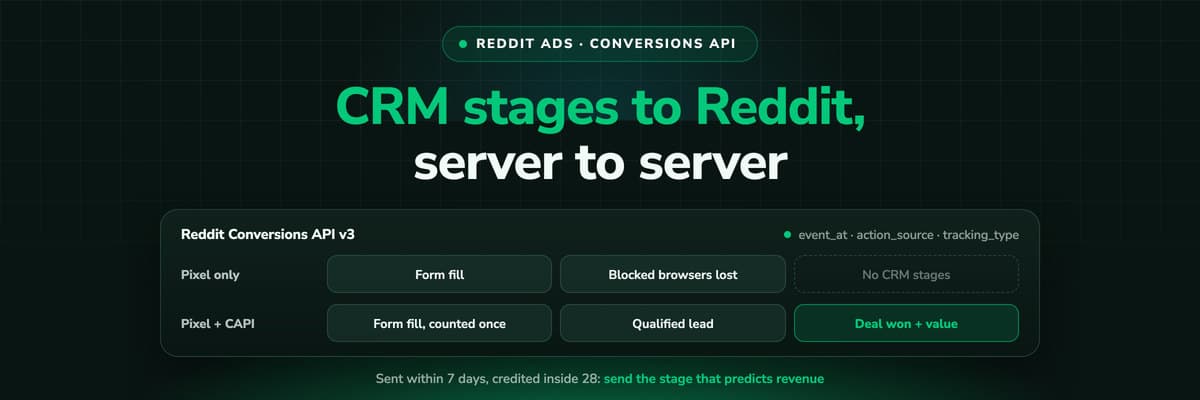 How To Guides
Reddit Conversions API: Setup, Deduplication and CRM Events
The Reddit Pixel reports what a browser lets it see. The Conversions API reports what your server tells it, including stages that happen in the CRM after the form. The v3 endpoint and body, the access token, match keys and hashing, deduplication against the Pixel, the click ID you have to keep yourself, test mode, limits, and what Reddit will credit from a CRM.Read the article18 min read
From the DSP click to the closed deal
Judge programmatic on the revenue it closed
LeadJourney records every DSP click with its UTMs server-side on your own domain, carries the line item onto the lead in your CRM and reports cost per qualified lead and closed revenue per channel. Live in 21 minutes.