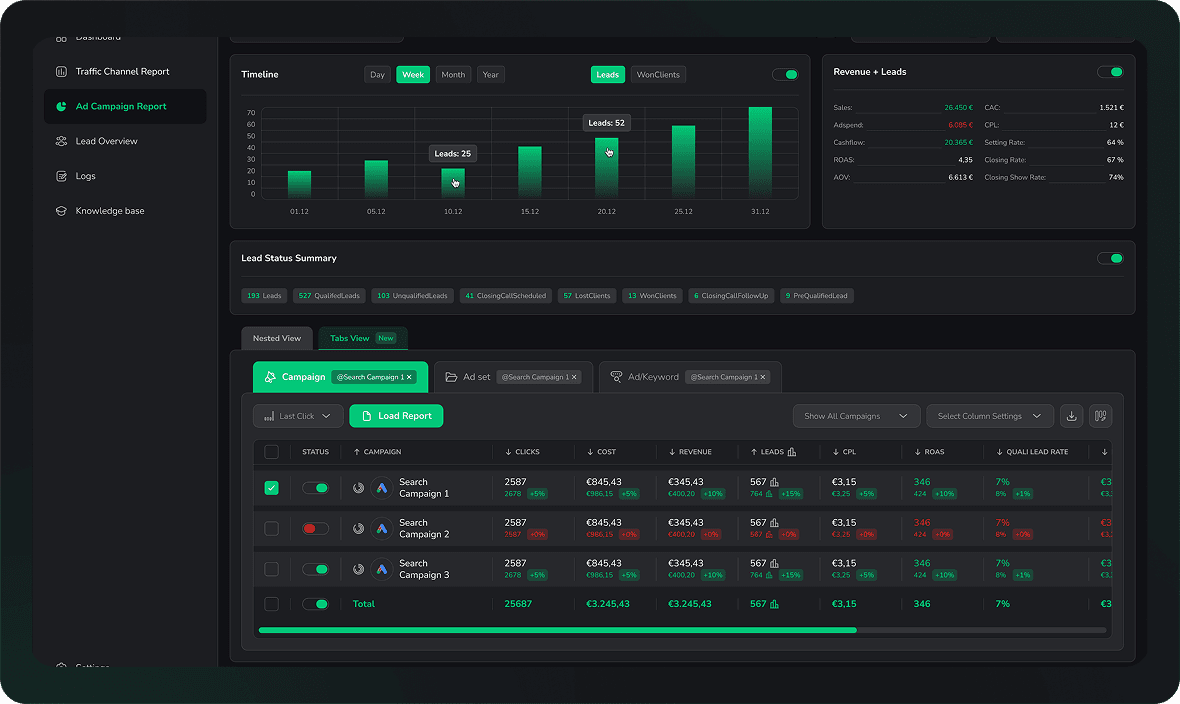














Tableau integration
Tableau marketing attribution you can actually drill into
LeadJourney streams the attributed dataset into your BigQuery at one journey per lead, so a Tableau viz goes from the channel all the way down to the named deal it produced.
30-day money-back guaranteeSetup with a tracking expert
- Live in 21 minutes
- 95%+ accuracy, first-party
- Live or extract
Rated by the teams who connected their stack
How the data moves
- Organic search
- Organic social
- AI search
AI Attribution Engine
LeadJourneyServer-side tracking, every channel in one journey- Server-side tracking of every visit
- Multi-touch attribution per lead
- Streamed into your BigQuery dataset
TableauWhere the analysis happens- Data source
- Workbook
- Extract
Tableau ships a Google BigQuery connector, so the dataset LeadJourney fills is a published data source like any other. Live for the analysis you are in the middle of, an extract for the workbook everyone opens.
Trusted by 100+ lead generation businesses, agencies and freelancers
The gap
Marketing is the one sheet nobody can drill into
Every other data source in the workbook goes down to a row: an order, a ticket, a patient, a shipment. Marketing arrives already summed by campaign and day, and an aggregate has nothing underneath it.
Marketing data as it usually arrives
Pre-aggregated, self-reported and impossible to join
- Platform exports are daily campaign rollups, so the lowest level of detail in the sheet is a campaign and a date.
- Each platform counts its own conversions, so two of them claim the same lead and a union double counts on purpose.
- The analytics export supplies sessions, collected in the browser, so ITP, ad blockers and declined banners take their share before the row exists.
- The CRM extract has the deal, the stage and the value, and no field on it names the campaign that started the journey.
- There is no key to join them on, so the relationship in the data source is a date and a channel name somebody standardised by hand.
- Which means no drill-down: you can see that paid search cost more this month, and not which deals it produced.
- And the workbook only reads. Nothing in it can tell Meta that the lead it delivered in March closed in June.
The dataset LeadJourney fills
One journey per lead, so the viz has somewhere to go
- Every visit is captured server-side and first-party on your own domain, at 95%+ accuracy, before any consent tool or ad blocker gets a vote.
- The grain is one journey per lead, with the touchpoints behind it, so a mark on a channel bar drills to the named deals underneath it.
- The CRM stage and the deal value are on the lead already, read from HubSpot, Salesforce, Pipedrive or a webhook.
- Spend is pulled from every connected ad account and normalised, so cost per qualified lead is a calculation over one source instead of a reconciliation.
- First click, last click, linear, position based and time decay are decided in LeadJourney, so the workbook is not carrying five competing definitions of credit in calculated fields.
- ChatGPT, Perplexity, Claude and Gemini arrive as distinct sources, which is a dimension no platform export offers today.
- And the same records go back to Meta, Google, LinkedIn and Microsoft Ads as conversions, which a workbook cannot do at all.
How it works
Tableau marketing attribution, through the connector you already have
Nothing to install from Tableau Exchange. LeadJourney fills a dataset in your own Google Cloud project, and Tableau reads it like any other BigQuery source.
1 The attributed dataset arrives in your project
Streaming, at lead level rather than as a daily rollup.


Ad clicks, spend, sessions and click IDs are tracked server-side across paid, organic and AI search.
The CRM stage and the deal value join the journey, and the revenue is attributed with the model you chose.

Clicks, conversions and leads stream into a dataset in your own Google Cloud project as they happen.
Your project, your region, your access rules. LeadJourney writes rows and reads nothing back.
2 Tableau reads it, and the marketing sheet gets a drill-down
Live while you are exploring, an extract for the published workbook.
Add the dataset with Tableau's built-in Google BigQuery connector, on a service account your team controls.
Relate it to the CRM and revenue sources you already publish. The lead is the key, which is the join that was missing.
A channel bar drills to campaigns, to landing pages, to the named deals underneath, in one viz.
Publish it to Tableau Cloud or Server as a governed data source, on your refresh schedule and your permissions.
The return path
A workbook explains what happened. The same records change what happens next.
Analysis is where a marketing data project usually stops, because a warehouse and a BI tool can only read. Telling the ad platforms which leads actually closed is the half that moves the number.
- MetaConversions API
Qualified leads, booked meetings and won deals, with the deal value
- Google AdsOffline conversion import
Deals matched on gclid, with the revenue for value based bidding
- LinkedIn AdsConversions API
Stage changes and won deals matched on li_fat_id
 Microsoft AdsOffline conversions
Deals matched on msclkid, with the amount
The workbook and the ad account agree
The row the viz draws and the conversion Meta received come from the same record, so a disagreement between two screens is not a thing that happens.
You choose what counts
Map any CRM stage to any platform event. Qualified lead, meeting booked, deal won, or all three, each with its own value.
Sent server to server
No pixel to fire, nothing for an ad blocker or a declined cookie banner to remove on the way out.
Reporting
The views the marketing sheet could not support
Each of these is also a built-in LeadJourney report, so the marketing team is not waiting on a workbook. The dataset is there for the analysis only your business does.
Which deals did paid search actually produce last quarter, by name, not by conversion count?
What does a qualified lead cost per channel, per segment and per region, on one consistent source?
Which landing pages start the journeys that end in a won deal, rather than the ones with the best form rate?
How much pipeline came from ChatGPT, Perplexity and Gemini, as sources of their own?
How does the same period look on first click and on last click, side by side?
Which channels bring the customers who stay, once you relate them to the retention source you already publish?
LeadJourney and the marketing sources you connect yourself
Where the data source list ends and LeadJourney starts
Tableau will connect to every marketing source you own and relate them properly. None of those sources contains the link between the ad click and the deal, because none of them was watching both.
| Capability | Marketing sources you connect yourself | With LeadJourney |
|---|---|---|
| Tableau marketing attribution | Marketing sources you connect yourselfA relationship on a date and a channel name somebody standardised, because the sources share no real key. | With LeadJourneyThe lead is the key. The click, the campaign, the CRM stage and the deal value are already on the same row. |
| Level of detail | Marketing sources you connect yourselfA daily campaign rollup. That is the lowest grain the platform exports offer, so there is nothing to drill into. | With LeadJourneyOne journey per lead, with its touchpoints behind it, so a mark drills from the channel to the named deal. |
| Where the click data comes from | Marketing sources you connect yourselfAn analytics export collected in the browser, so ITP, ad blockers and declined banners take their share before the row exists. | With LeadJourneyServer-side and first-party on your own domain, at 95%+ accuracy, with the click IDs stored at the moment of the click. |
| CRM revenue on the row | Marketing sources you connect yourselfA separate CRM extract, on its own schema, with no field naming the campaign. | With LeadJourneyThe stage and the deal value are read from HubSpot, Salesforce, Pipedrive, Close, Attio or a webhook and travel with the lead. |
| Double counted conversions | Marketing sources you connect yourselfBuilt in. Two platforms both claim the lead they each touched, and a union adds them together. | With LeadJourneyOne record per lead, credited once, with the model deciding how the credit is split. |
| Attribution models | Marketing sources you connect yourselfCalculated fields per model, and the workbook ends up carrying every definition anybody has asked for. | With LeadJourneyFirst click, last click, linear, position based and time decay, decided in the product, so the source carries one answer. |
| Live or extract | Marketing sources you connect yourselfWhatever the source supports, on a refresh somebody maintains per connector. | With LeadJourneyBoth, because it is a BigQuery source. Rows stream in on their own, so a stale extract is a schedule decision rather than a broken job. |
| Conversions back to the ad platforms | Marketing sources you connect yourselfOut of scope. A workbook reads and never writes. | With LeadJourneyEvery stage change and won deal goes back to Meta, Google, LinkedIn and Microsoft Ads from the same rows. |
| The marketing team without Tableau | Marketing sources you connect yourselfReads the published dashboard, and asks the follow-up question in the meeting. | With LeadJourneyHas the reports, the dashboards and Atlas in plain language, on the same data the workbook reads. |
Keep the workbook. Give the marketing sheet a grain.
Tableau stays where the analysis happens and where the governed data sources live. LeadJourney supplies the one marketing source that goes down to a row rather than stopping at a daily total, and it hands that same record back to the ad platforms on the way past.
MCP server
The question that does not deserve a workbook
Not every question is worth a sheet, a filter and a published data source. Ask in Claude, ChatGPT or Cursor instead, and the answer comes from the same numbers the viz draws.
LeadJourney MCP connected, try any tab
Which campaigns produced our closed revenue last month?
Based on your LeadJourney data, 3 campaigns produced 148,200 EUR of closed revenue last month:
- Google Ads, Brand
- 38 leads, 9 closed deals, 61,400 EUR. Shortest path to signature.
- LinkedIn, Retargeting
- 21 leads, 6 closed deals, 48,900 EUR. Seven touchpoints on average.
- Meta, Lookalike DACH
- 54 leads, 5 closed deals, 37,900 EUR. Cheapest qualified lead.
Want this as a weekly summary in Slack?
Ask anything about your lead journeys
Where did our three biggest deals this quarter come from?
Your 3 largest deals this quarter all started somewhere the last click never showed you:
- 42,000 EUR
- First touch LinkedIn Ads, closed 63 days later after a webinar signup.
- 28,500 EUR
- First touch Google organic, paid click on day 11, demo on day 19.
- 21,800 EUR
- First touch a Meta video view, form filled from email six weeks on.
Want the full touchpoint list for any of them?
Ask anything about your closed deals
Which landing pages turn LinkedIn traffic into qualified leads?
3 pages take your LinkedIn traffic, and the qualified rate between them runs from 4% to 18%:
- /demo/attribution
- 18% qualified from 214 visits. Highest intent page on the site.
- /guide/server-side
- 9% qualified from 612 visits. Most journeys stall after the download.
- /pricing
- 4% qualified from 488 visits. Second most traffic, lowest intent.
Want the same breakdown for Google Ads traffic?
Ask anything about your landing pages
What did each channel cost per qualified lead last week?
3 channels spent budget last week. Cost per qualified lead ran from 41 EUR to 187 EUR:
- LinkedIn Ads
- 41 EUR per qualified lead. 2,300 EUR spent, 56 qualified.
- Google Ads
- 88 EUR per qualified lead. 4,400 EUR spent, 50 qualified.
- Meta Ads
- 187 EUR per qualified lead. 3,740 EUR spent, 20 qualified.
Want an alert the moment a channel passes 120 EUR?
Ask anything about your cost per lead
What do the journeys that close have in common?
3 signals show up in most of your closed deals and in almost none of the lost ones:
- Pricing page, 2+ visits
- In 71% of closed deals. In 12% of the ones that never closed.
- Demo within 14 days
- In 64% of closed deals. Median 9 days from the first click.
- Second contact
- In 58% of closed deals. A colleague of the lead arrives on site.
Want these three scored onto every lead in your CRM?
Ask anything about your lead journeys
Setup
From the first click to a published data source
Nothing from Tableau Exchange, no web data connector to host and no extract job to write.
- 1About 21 minutes
Add a single line of code
Paste the LeadJourney script into your site or your tag manager, and connect the ad accounts you buy on and the CRM your deals live in. This is what produces the grain the workbook has been missing.
- 2About 5 minutes
Switch the BigQuery export on
Create a service account in your own Google Cloud project with write access to the dataset you want filled, and paste its key into the BigQuery app. Available on the Scale and Enterprise plans.
- 3Same day
Publish it as a data source
Add the dataset with Tableau's built-in Google BigQuery connector, live or as an extract, relate it to the CRM and revenue sources you already publish, and put it on Tableau Cloud or Server with your usual permissions.
Original reviews
What our customers wrote, word for word
4.9 out of 5 across 11 public reviews. Quoted as they were left, shortened only by dropping whole sentences.
- 5 out of 5 starsGoogle
“Before LeadJourney, we had no reliable tracking concept for our five-figure ad spend. We were manually building spreadsheet and CRM reports, inaccurate and time-consuming. Within two days, everything was set up. For the first time, I know exactly what I pay per lead and which campaigns actually bring in the best-qualified prospects.”
 Florian BuckCEO, Klickkraft GmbH
 “With LeadJourney we are able to track all our leads and connect them with sales and attribution data to make better decisions. In the first month of using it we scaled from 0 to 100k revenue from paid ads only.”
 GetreachBacklinks Marketplace (SaaS)
- 5 out of 5 starsG2
“LeadJourney finally fixed my Marketing Analytics. It goes way beyond basic Ad Tracking Software. The Customer Journey Report saves hours of digging, and capturing everything from Offline Conversions to AI Search Tracking makes it the Best B2B Attribution Platform available.”
Sascha LenzMarketing Manager
- 5 out of 5 starsTrustpilot
“Connected LeadJourney for 2 clients, setup took literally 20 minutes each. The data became more accurate, the reports actually make sense. Now clients look at the dashboard and the 'why don't the numbers match?' questions are gone.”
 Alexander SamarPerformance Marketing Agency
 - 5 out of 5 starsGoogle
“With LeadJourney, we have finally found a tool that provides us with the data we need to scale our performance marketing campaigns. The most important KPI is no longer lead price but cost per qualified lead.”
 Steffen SiesingCEO, Bilanzmanufaktur GmbH
- 5 out of 5 starsG2
“The ability to track both online and offline conversions in one unified dashboard has given us insights we never had before. Our ROI has improved dramatically since we started integrating LeadJourney with our CRM. We're finally able to see the full customer journey, and it's been a game changer for our strategy.”
 Andre WitzelFounder, Trading.de
 - 5 out of 5 starsTrustpilot
“The ability to seamlessly integrate data from multiple channels and see real-time insights has significantly improved our campaign results. We now focus on metrics that truly matter, like ROI and qualified leads.”
 Nikita YatsunCEO, RLV Media GmbH
Read the reviews where they were left
FAQ
What analysts ask before publishing the source
If yours is not here, our team answers in the chat within a few minutes.
Is there a LeadJourney connector on Tableau Exchange?
No, and the setup is simpler without one. LeadJourney streams the attributed dataset into a BigQuery dataset in your own Google Cloud project, and Tableau's built-in Google BigQuery connector reads it. Nothing to install, nothing to host and no web data connector for your team to keep alive.
What is the grain, and can I really drill to a deal?
One journey per lead, with the touchpoints behind it, which is the whole reason this page exists. A mark on a channel bar has rows underneath it, so the drill goes channel to campaign to landing page to the named leads and the deals they became.
Live connection or extract?
Both, because both are properties of Tableau's BigQuery connector. A live connection suits the analysis you are in the middle of; an extract on your normal schedule suits the workbook the whole company opens. Rows stream into the dataset either way, so the extract is only ever as old as its schedule.
How does it relate to the CRM source we already publish?
On the lead, which is the join that has been missing. Both sides describe the same person or company, so the relationship is a real key rather than a date and a channel name somebody standardised by hand.
Whose Google Cloud project is the data in?
Yours. You create the dataset, you set the region and the access rules, and you pay Google for storage and queries as you already do. LeadJourney writes rows with a service account key you issue and can revoke at any time, and Tableau reads with a service account your team controls.
Does this change our governance on Tableau Cloud or Server?
No. It is another BigQuery data source in your environment, so your publishing rules, permissions and row-level security apply to it unchanged.
Can we do this without a warehouse?
Tableau can read a Google Sheet that the Zapier app or the API fills, which is on every plan, and small teams do that. For an organisation already publishing governed data sources it is the wrong shape, which is why the export is the recommendation here.
Several regions or business units, several workspaces?
Each LeadJourney workspace exports to its own dataset, so each entity's data stays in its own project and the workbook still relates the whole group together. Bring the shape you need to the call before the rollout.
Which plans include the export?
The Scale and Enterprise plans, alongside API access. On every plan the same data is reachable through the API, the Zapier app, webhooks and the MCP connection.
Is exporting to our own warehouse GDPR compliant?
It is the arrangement most data protection officers prefer, because the data lands in infrastructure you control under your own agreement with Google. On our side, LeadJourney processes and stores data in the EU, signs an Art. 28 data processing agreement, and tracks first-party and server-side so consent decisions are respected rather than worked around.
More integrations
More data and BI integrations
The export lands in BigQuery, and these read BigQuery natively. No connector to install and none written by us.
A marketing source with a grain
Give the Tableau workbook marketing data it can drill into
Connect your ad accounts and your CRM, switch the BigQuery export on, and the marketing sheet goes from a daily total to the named deals underneath it.
30-day money-back guaranteeSetup with a tracking expert