
















BlogHow To Guides
B2B Buyer Journey: Stages, Statistics and Measurement (2026)
Every B2B team has two buyer journeys: the one mapped in a workshop and the one recorded in the tracking data and the CRM. The stages, Gartner's six buying jobs, the statistics worth knowing, one recorded €46,000 journey touch by touch, and how to build the map from the record and set the budget by it.

Contents
Summarise this article with AI
Opens the page with a ready prompt in:


Nothing is sent until you pick a service.
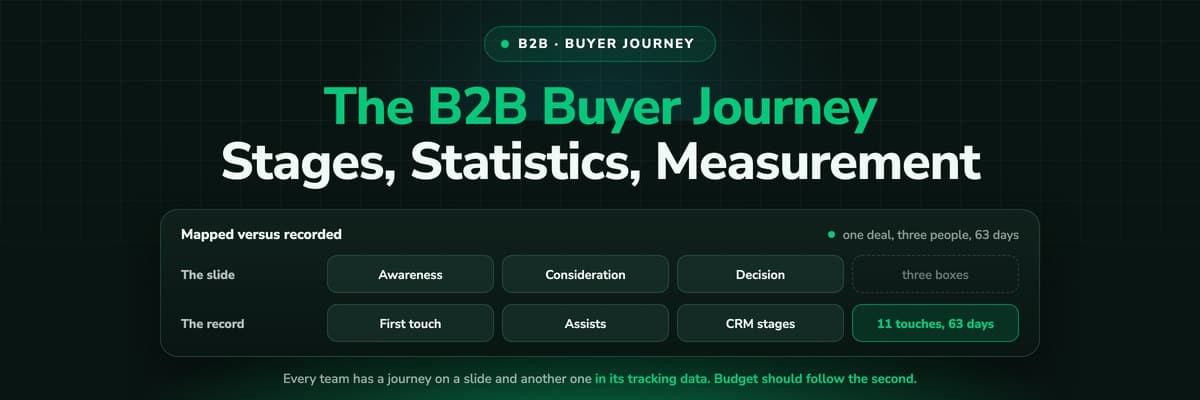
Every B2B marketing team owns two buyer journeys. The first is on a slide: three stages, a persona with a name and a job title, the content mapped to each step, produced in a workshop and revised once a year. The second is in the data: the sessions the tracking script recorded, the forms that were filled, the calls the reps logged and the stages the deals moved through. The two rarely agree.
This guide covers both. The stages and Gartner's six buying jobs, the statistics on buying groups and cycle length that shape the problem, and then the part most guides leave out: how to read the journey your CRM actually recorded, what a real one looks like touch by touch, and why the recorded journey is the one a budget should follow.
Quick Summary: The B2B Buyer Journey in One Paragraph
In short
The B2B buyer journey is the path a buying group takes from noticing a problem to signing a contract. It has three stages (awareness, consideration, decision) and, in Gartner's research, six buying jobs that six to ten people work through in loops, not in order, most of it before any vendor is contacted. Every team has two versions of it: the one mapped in a workshop and the one recorded in the tracking data and the CRM. They disagree on where journeys start, how long they take and which channels assist; the budget should follow the recorded one. Recording it takes first-party, server-side capture of the first click, an identity at the form, call or booking, and CRM stages carried to the closed deal. LeadJourney records that journey at 95%+ tracking accuracy with a 21 minute setup.
What Is the B2B Buyer Journey?
The B2B buyer journey is the sequence of steps a business goes through between recognising a problem and buying something to solve it: the searches, the ads clicked, the articles read, the colleagues consulted, the shortlist, the demos and the signature. It is a journey because it has an order and a duration, and a buyer journey because the person taking it buys for an organisation, with other people's money and other people's approval.
That last clause is the whole difference from consumer buying. A consumer decides alone, often in one session, and the purchase ends the story. A business buyer decides with a group, over weeks or months, and justifies the decision to people who were not in the room. So the journey has more people, touchpoints, channels and time in it than the seller's funnel suggests.
Two neighbouring terms are worth separating. The customer journey is the longer arc that continues after the purchase into onboarding, renewal and expansion; the buyer journey is the part that ends at the signature. The sales funnel is the seller's view of the same period, the stages a rep moves a deal through. The buyer journey is the buyer's own sequence of actions; the funnel stage is the seller's label for how far it has got.
The one-line version
The funnel is what the seller does to the deal. The buyer journey is what the buyer does before there is a deal. Attribution is the work of joining the two on one record.
The Stages of the B2B Buyer Journey
The textbook version has three stages, and every CRM, content plan and board slide is built around them. Awareness is recognising a problem and learning that a category of solution exists. Consideration is building the shortlist: comparing approaches, reading reviews, asking peers, pricing it up. Decision is picking the vendor, getting sign-off and buying. Content is mapped to them: a guide for awareness, a comparison for consideration, a case study and a demo for the decision.
Gartner's research on B2B buying replaced the three stages with six buying jobs, and its most quoted finding is that buyers do not complete them in order. A group builds requirements, sees a demo, finds a requirement it had missed, and goes back to exploring solutions. The jobs are done in loops, revisited whenever a stakeholder joins or a vendor is named. Here are the six, with what each leaves in the record.
Problem identification
The group agrees there is a problem worth solving. In the record: the first search, the first ad click, the first article read, by one person, weeks before anyone else is involved.
Solution exploration
Finding out what kinds of solution exist and who sells them. Comparison articles, review sites, peer recommendations and the first vendor sites, most of it in sessions no vendor can yet name.
Requirements building
Turning the problem into a list of things the solution must do. Checklists and buyer's guides get downloaded here, often the first form fill and the moment the journey gets a name.
Supplier selection
Narrowing to a shortlist and picking one. Demos, pricing pages, trials and proposals. The stage sales sees most of, and the one where brand search and direct visits cluster in the record.
Validation
Checking that the choice holds up: references, case studies, the security page, the DPA, a peer who already uses it. Often done by a second person who never filled a form.
Consensus creation
Getting the group to agree, including the people who joined late. Internal meetings, a forwarded proposal, a budget holder reading the pricing page once. Almost entirely invisible to the seller's tracking.
Both frameworks are worth keeping because they describe different things. The three stages are the seller's labels for where a deal has got to, and they map onto CRM stages. The six jobs are what the buyer is doing, and in tracking data they show up as revisits: the comparison page again after the demo, the pricing page from three browsers, the security page two days before the contract. Those loops are the recorded journey, and no slide draws them.
B2B Buyer Journey Statistics Worth Knowing
A handful of figures from the research firms appear in every deck about B2B buying, with two caveats. They are other people's surveys, so the numbers below are given as reported and rounded, not as anything we have measured. And each has a consequence for measurement the deck leaves out, which is the third column.
What the research reports, and what each figure does to the record
| Finding, as reported | Source | What it means for measurement |
|---|---|---|
| Buying groups of six to ten decision makers | Gartner's research on B2B buying | The record names one or two of a group of six to ten. The rest are anonymous sessions, or absent. |
| Buyers spend about 17% of the purchase time meeting suppliers | Gartner | What is recorded of the journey comes from the site and the ads, not from the call log. |
| Most of the journey is complete before a vendor is contacted, reported at 70 to 80% | Several research firms, over several years | By the form fill, the first touch is weeks old. A record that starts at the form has missed most of the journey. |
| Around ten interaction channels per journey | McKinsey's B2B Pulse research | No ad platform sees past its own channel. The record has to live outside the platforms to hold all ten. |
| Roughly 95% of a category's buyers are not in market at any given time | The LinkedIn B2B Institute's 95:5 rule, as reported | Most impressions reach people who will not fill a form for months. Their first click has to survive that long. |
| Cycles measured in months, longer for enterprise deals | Industry surveys, widely varying | A seven day cookie or a 30 day window expires before the deal closes. Set the window from your own time to close. |
Read together, the figures describe a journey longer than a browser cookie, wider than one person and spread across more channels than any platform can see. Each of the three breaks a different piece of the default measurement stack, and the rest of this guide is about the record that survives all three.
The Mapped Journey vs. the Recorded One
A journey map is produced in a workshop. Somebody draws the three stages on a whiteboard, a persona gets a name and a job title, and the team writes down what that person thinks and reads at each stage. It is useful for planning content and almost always wrong about sequence and duration, because it is built from what the team remembers of the deals that went well, and memory compresses 63 days into three tidy steps.
The recorded journey is what the tracking data and the CRM hold: the sessions, the source on each, the forms, the calls and the stage changes, with timestamps. It is incomplete in ways a later section is honest about, but it has one property the map never has. Nobody remembered it. It is the sequence as it happened, for every deal, and it can be counted.
Between the two sits the question on the form: how did you hear about us? Self-reported attribution is worth collecting, because it catches the podcast, the conference and the recommendation no script can see. It is also one answer from a person recalling weeks of activity, and it leans toward the most recent or most memorable touch. Keep it as a column next to the recorded source, never instead of it, as the use case page shows.
The dark funnel is the part of the journey that leaves no trace on your domain: peer conversations, communities, podcasts, a competitor's comparison page. In the record it appears as direct traffic or a branded search with no earlier session behind it. The honest treatment is to name that gap and measure it, rather than let a model hand the credit to whichever tracked touch came next.
Then there is what the CRM's source field holds: whatever the form integration wrote or a rep picked from a dropdown, and on many records Direct, Offline sources or Unknown, because the click id never reached the contact. What the CRM says the lead source is and lead source tracking in HubSpot go into why. A source written by a browser session weeks after the first click is not the first click.
One Recorded Journey, Touch by Touch
Here is a recorded journey laid out end to end. The deal is an example rather than one customer's record, but the shape is the ordinary one for mid-market software: €46,000 of annual licence, three people from one company, eleven touchpoints over 63 days. Lena runs operations and starts the search. Tobias is the finance director. Marc is the managing director who signs.
- Day 0. LinkedIn Ads, Lena. A sponsored post in the feed. She clicks, reads a guide, leaves. Anonymous, but the li_fat_id and the landing page are on the record from this session on.
- Day 4. Organic search, Lena. She searches the category and lands on a comparison article. Same browser, so the session joins the one from day 0.
- Day 9. Google Ads, non-brand search, Lena. She downloads a requirements checklist and fills the form. The journey gets a name, and the two anonymous sessions before it attach to her contact.
- Day 12. Nurture email, Lena. The second mail of the sequence. She clicks through to the pricing page and stays four minutes.
- Day 16. Direct, Tobias. A link pasted into the company chat. The finance director reads the pricing page. Anonymous; nothing ties the session to the deal until he is named on it.
- Day 21. Meta retargeting, Lena. She clicks the ad and watches the product video.
- Day 27. Webinar, Lena. She registers with the same email and attends. Second form, same contact.
- Day 30. Google Ads, brand search, Lena. She types the vendor's name, clicks the ad above the organic result and books a demo. The deal is created, stage demo booked.
- Day 34. Demo call, Lena and Tobias. The rep logs the meeting and adds Tobias to the deal as a second contact. His day 16 session stays anonymous: a rep added him, not a form.
- Day 47. Direct, Marc. The managing director opens the security page and a customer story from a forwarded link. Anonymous. He enters the record two days later, as a note: the MD wants the DPA.
- Day 63. Contract call, Marc and Lena. Marc asks two questions about the DPA and signs. Closed-won, €46,000, written to the deal.
Seven of the eleven are marketing touches on Lena's named journey, and those seven are what an attribution model has to work with. Here is the €46,000 credited four ways across them. The two sales calls and the two anonymous visits are on the record but carry no marketing credit here; the B2B marketing attribution guide covers the sales half.
€46,000 across the seven marketing touchpoints, whole euros, the linear remainder on the last row
| Touchpoint | First click | Last click | Linear | Position-based |
|---|---|---|---|---|
| LinkedIn Ads (day 0) | €46,000 | €0 | €6,571 | €18,400 |
| Organic search (day 4) | €0 | €0 | €6,571 | €1,840 |
| Google Ads, non-brand (day 9) | €0 | €0 | €6,571 | €1,840 |
| Nurture email (day 12) | €0 | €0 | €6,571 | €1,840 |
| Meta retargeting (day 21) | €0 | €0 | €6,571 | €1,840 |
| Webinar (day 27) | €0 | €0 | €6,571 | €1,840 |
| Google Ads, brand (day 30) | €0 | €46,000 | €6,574 | €18,400 |
Now put the workshop map next to it. The map had one persona, three stages and a journey that began with a search. The record has three people, a LinkedIn ad at the start, a webinar and a nurture mail in the middle, a brand search at the end, and a finance director on the pricing page two weeks before sales knew he existed. Under last click the campaign that opened the deal earns nothing, and the map would never have said so.
How to Map the B2B Buyer Journey From the Data
The record only becomes a map once it is aggregated, a few hours of work if the data exists. The order matters: start from the outcome and work backwards. A map built from leads describes the people who filled forms; one built from won deals describes the people who bought, and those are different populations with different journeys.
- Start from won deals, not from leads. Pull every closed-won deal of the last two or four quarters and list the first touch of each: channel, campaign, date. That is your awareness stage as it happened, usually shorter and more paid than the slide says.
- List the assists. For the same deals, every touch between the first one and the form, by channel: comparison pages, webinars, retargeting clicks, emails. Count how often each channel appears per deal rather than in total, so one heavy journey does not dominate.
- Measure the time between stages. First touch to form, form to demo, demo to close, as a median and an 80th percentile. The median is your journey length; the 80th percentile is the window you need, because a window sized to the median loses a fifth of the deals.
- Count channels by position. Which channels open journeys, which assist, which close. Paid social and non-brand search cluster at the start, email and retargeting in the middle, brand search and direct at the end. A channel that only appears last is being paid for demand something else created.
- Compare it with the slide, and let the record win. Where the map says the journey starts with a search and the record says a LinkedIn ad, rewrite the map. Where the persona is one person and the record shows three browsers per deal, rewrite the persona.
Do it per segment once the volume allows: deal size, industry, region. And keep the sample honest: a quarter with 14 won deals gives a shape, not a statistic, and a shape is checked against the next quarter rather than acted on. Customer journey tracking shows the per-lead view this is built from.
LeadJourney finally fixed my Marketing Analytics. It goes way beyond basic Ad Tracking Software. The Customer Journey Report saves hours of digging, and capturing everything from Offline Conversions to AI Search Tracking makes it the Best B2B Attribution Platform available.
What the Recorded Journey Changes for the Budget
The point of the exercise is not a better slide. It is four decisions about money that come out differently once the record replaces the map, and each of the four is visible in the €46,000 example above, under the models in that table.
- First-touch channels you cannot cutLinkedIn opened the €46,000 journey and earns €0 under last click. Cut it on that report and the deals that would have arrived in two months quietly stop arriving.
- Assist channels invisible under last clickThe nurture mail, the webinar and the retargeting click carry €19,713 under linear and €0 under last click. They read as cost until the model changes.
- Brand search closes journeys it did not startThe brand campaign earns the whole €46,000 under last click and €6,574 under linear. Its ROAS is real, and it is not the campaign to scale first.
- The window comes from the measured time to closeThis deal took 63 days. A 30 day window on the first click closed the day the demo was booked, a month before the deal did. Set it from your own record.
None of the four is an argument for first click over last click. It is an argument for looking at the same deals under more than one model, on closed revenue rather than form fills, and asking which channels change rank. Optimising on revenue covers the budget side; the true cost per lead covers why the cheapest lead and the cheapest customer rarely share a channel.
Journey Length and the Attribution Window
The 63 days in the example are what breaks most measurement setups, and it is worth being precise about how. An attribution window is the period after a click during which a platform will still credit a conversion to it. Meta's default click window is seven days; Google Ads sets one per conversion action, up to about ninety days; LinkedIn offers a selectable range. Once it closes, the click has left the platform's ledger and nothing uploaded later can be attached to it.
The browser has its own window. A cookie set by JavaScript is capped at seven days in Safari, so a visitor who clicks on day 0 and fills the form on day 9 is, to a browser-side script, two different people. Lena's LinkedIn click would have left such a cookie by day 7, and a seven day platform window with it. Her journey would have started at the Google search on day 9, and LinkedIn would have earned nothing under any model.
Two things follow. The identifier has to be set by your own domain and kept on the server, which is what server-side tracking means, and why the click id is read at the first visit rather than at the form. The window has to come from the measured time to close, the 80th percentile from the mapping step, not from a default designed for checkouts. Where the platform's window is shorter, send an intermediate stage back early; attribution for long sales cycles covers that cadence.
The Limits of the Recorded Journey
The record is better than the map, and it is not complete; a guide arguing for it should say where it stops. Tobias read the pricing page on day 16 and Marc the security page on day 47, and neither session is on a named journey: both were anonymous browsers until a rep typed a name onto the deal. Marc's conversation with a peer is in no system. The fourth stakeholder, who objected internally and never visited, exists nowhere in the record.
Those gaps are the buying group problem, and the industry has two architectural answers. Lead-level attribution follows a named person's journey and joins it to the deal. LeadJourney works this way, as do the CRMs' own tools: where a deal has several contacts, each contact's journey sits on the deal's record, but the model does not identify the anonymous colleagues and does not pretend to. It fits inbound and paid funnels where the buyer identifies at a demo request, with faster setup and public pricing.
Account-level attribution models every stakeholder's touches on one company timeline. Dreamdata, HockeyStack, Factors.ai and Adobe Marketo Measure are built this way, and Dreamdata and Factors.ai identify the companies behind anonymous visits, so Tobias's day 16 session would have carried his employer's name. It is right where the buying group is large and mostly anonymous, the deals are six figures, the motion is account based and a RevOps team runs it. The B2B marketing attribution guide sets the two side by side.
How LeadJourney Records the Journey
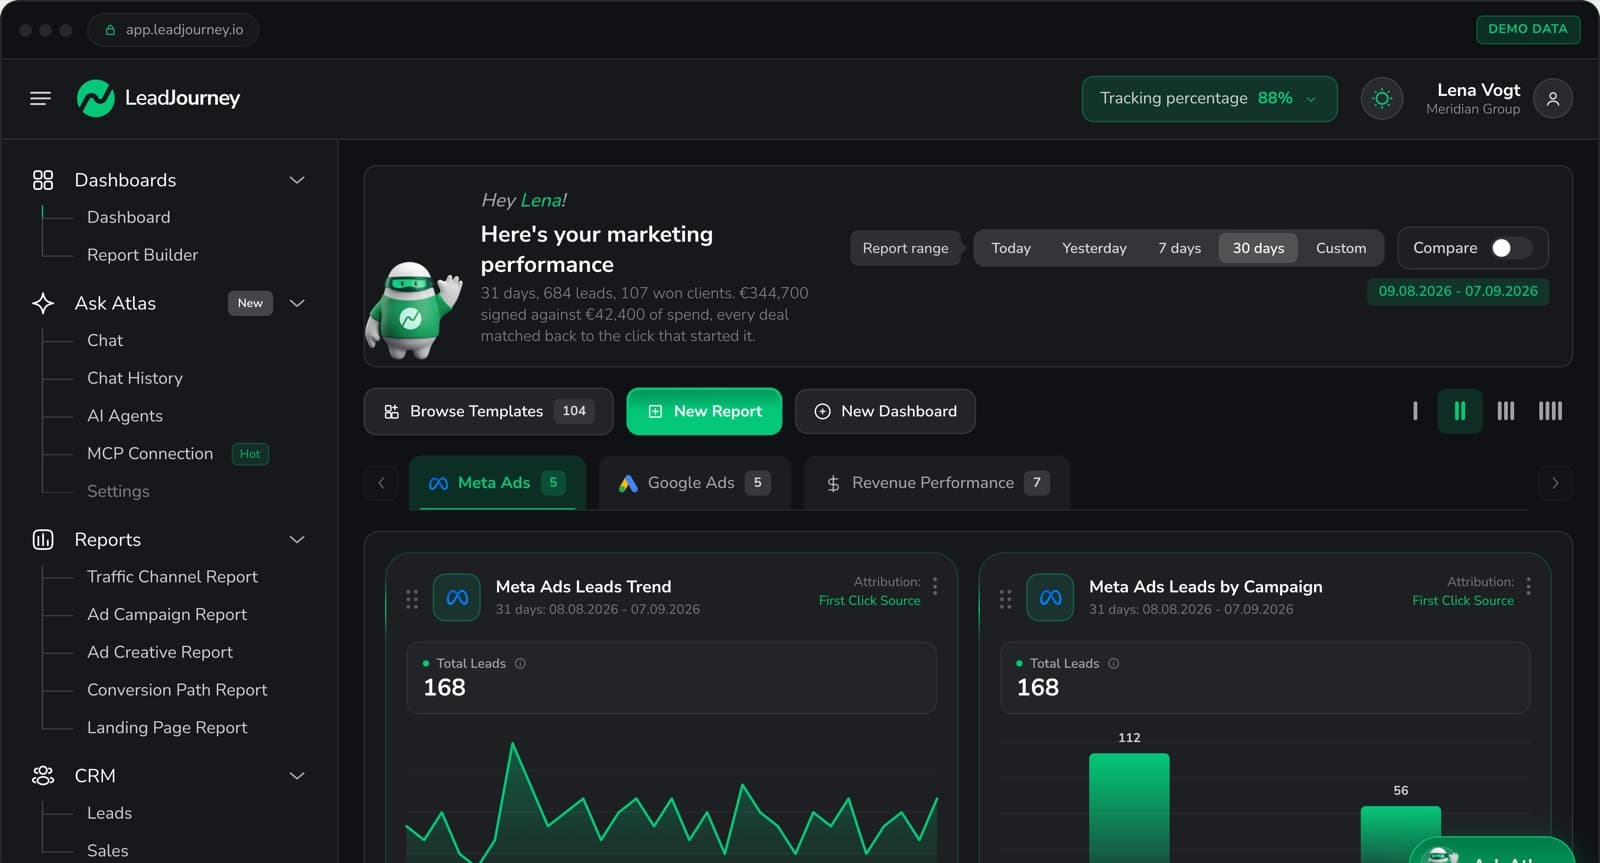
LeadJourney records the journey this way. Tracking runs server-side on your own domain, first-party, at 95%+ accuracy. The first visit sets the LeadJourney Click ID, our own identifier for that visitor, kept in the browser for weeks or months with every later session appended, and stores the platform click ids on it: gclid with gbraid and wbraid, fbclid, li_fat_id, msclkid and ttclid, plus the UTM parameters and the landing page. Lena's day 0 LinkedIn click is still there when she fills the form on day 9.
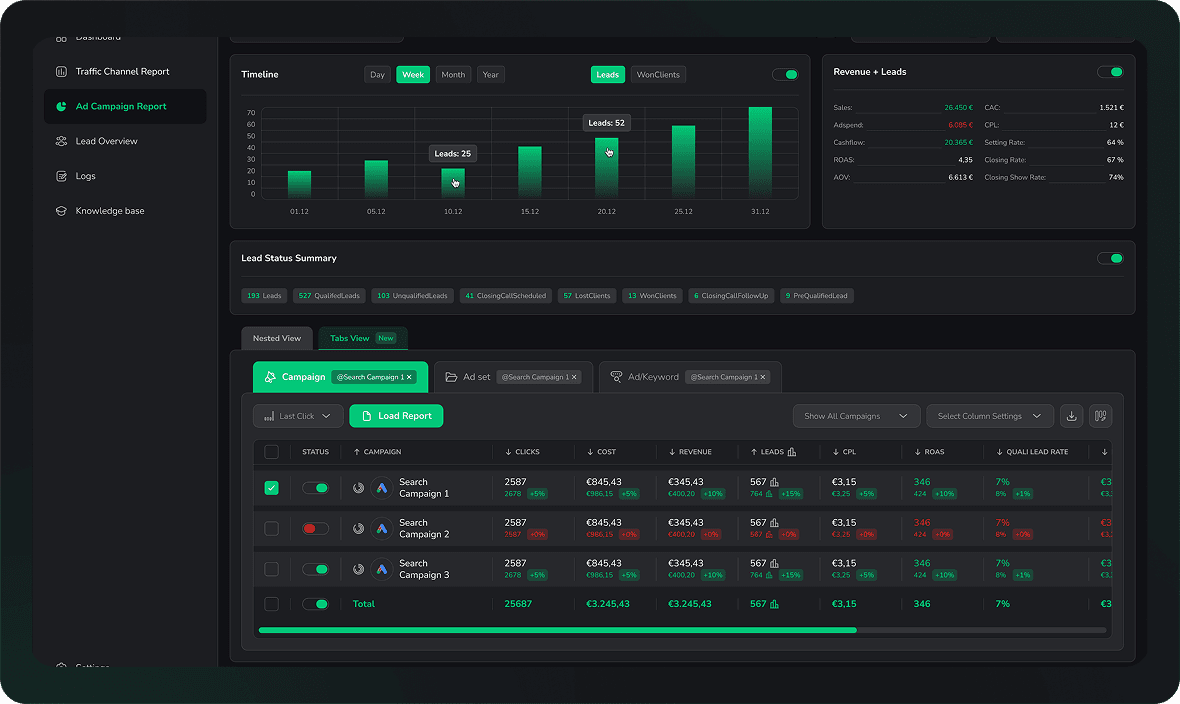
The visitor becomes a person at the form fill, call or booking, and the journey follows the CRM stages to the closed deal: natively in HubSpot, Salesforce, Pipedrive, Close, Attio, GoHighLevel, ActiveCampaign and Odoo, by webhook or the API otherwise. Every lead has a journey view with every touchpoint dated. The channel, campaign and landing page reports switch between five models on every plan, closed stages go back to Meta, Google, LinkedIn and Microsoft with the deal value, and it is lead-level. See it in the live demo.
Further Reading
Related reading: B2B marketing attribution for the discipline this journey feeds; the best cross-channel attribution tools for the tools; cross-channel attribution for why platform numbers never add up; multi-touch attribution for B2B and for B2B lead generation for the models; attribution for long sales cycles for the 63 day problem; the customer journey, the attribution window and revenue attribution in the glossary; customer journey tracking and multi-touch attribution as product pages; and the pages for SaaS companies, demand generation and marketing leaders.
FAQ
Frequently Asked Questions
What marketers and RevOps teams ask before they measure the journey instead of drawing it.
What are the stages of the B2B buyer journey?
The textbook version has three: awareness, where the buyer recognises a problem and learns a category of solution exists; consideration, where they build a shortlist and compare; and decision, where they pick a vendor and get sign-off. Gartner's research replaces the three with six buying jobs (problem identification, solution exploration, requirements building, supplier selection, validation and consensus creation) and finds that buyers work through them in loops rather than in order. In tracking data the three stages appear as CRM stage changes and the six jobs appear as revisits: the same pricing page opened from three browsers over six weeks.
How long is the B2B buyer journey?
Longer than most measurement assumes. Surveys from the research firms put a typical considered B2B purchase at months rather than weeks, longer for enterprise deals, and the number varies so much by deal size and industry that the useful figure is your own. Measure it from the record: the median time from a won deal's first touch to its close, and the 80th percentile. In the worked example in this guide a €46,000 deal took 63 days from the first ad click, which is already past a seven day cookie and a 30 day platform window. The 80th percentile is the attribution window you actually need.
How many people are involved in a B2B purchase?
Gartner's research puts the typical buying group at six to ten decision makers, each bringing their own information and their own objections. For measurement the number that matters is smaller: how many of those people ever identify themselves on your site. In most recorded journeys one or two do, at a form fill or a demo, and the rest appear as anonymous sessions, as names a rep adds to the deal, or not at all. Lead-level attribution follows the named ones and joins them to the deal; account-level tools try to place the anonymous ones under their company. Both leave the colleague who never visited outside the record.
What is the difference between the buyer journey and the customer journey?
The buyer journey ends at the purchase. It covers everything from the first recognition of a problem to the signature: the searches, the ads, the content, the demos, the internal approvals. The customer journey is the longer arc that contains the buyer journey and continues past it into onboarding, adoption, support, renewal and expansion. Marketing attribution is mostly concerned with the buyer journey, because that is where the acquisition budget is spent and where a closed deal can be credited back to the touches that produced it. Customer marketing and success teams own the part after the signature.
How do you map a B2B buyer journey?
The workshop method draws three stages, gives a persona a name and lists what they think and read. It is useful for planning content and unreliable about sequence and duration, because it is built from memory. The data method starts from won deals: list the first touch of each, then every assist between it and the form, then the time between stages as a median and an 80th percentile, then which channels open, assist and close. Where the two maps disagree, the record wins. A quarter with a dozen won deals gives a shape, not a statistic, so check it against the next quarter before moving budget.
How do you measure the B2B buyer journey?
Keep one record per person from the first click to the closed deal and read the journey off it. That takes four things: first-party, server-side capture on your own domain, so the first visit and its click id survive longer than a browser cookie; an identity at the form fill, call or booking, so the anonymous sessions before it are attached to the person; the source written onto the CRM contact and deal; and the CRM stages carried to the closed amount. Once that exists, first click, last click and linear are three views of one record, not three arguments, and the map is a report, not a slide.
Keep reading
More from the blog
 How To Guides
What Is RevOps? Revenue Operations and GTM Ops Explained (2026)
Revenue operations runs marketing, sales and customer success as one revenue engine: the funnel definitions, the CRM, the handoffs, the reporting and the forecast. GTM ops is the wider name the same job has been taking on. What the function owns, how it differs from sales ops and marketing ops, the stack, the metrics, and the one thing all of it depends on: whether the CRM record says where the customer came from.Read the article17 min read How To Guides
PostHog Attribution: How It Works and Where It Stops
PostHog can tell you where a user first came from and put ad spend next to your conversions. Here is exactly how its attribution works, what quietly breaks it, and the point where teams add something next to it.Read the article11 min read How To Guides
BigQuery Marketing Attribution Without the GA4 Blind Spots
You can write a multi-touch attribution model in BigQuery in about eighty lines of SQL. Here they are, free. What no tutorial tells you is that the GA4 export you are querying carries no ad cost, no CRM revenue, no attribution model result and none of the consent-modelled conversions your GA4 dashboard shows, so the finished query answers a question nobody in the budget meeting asked.Read the article18 min read
The journey as it happened
See the journey as it happened, not as it was drawn
LeadJourney records every click, form, call and CRM stage on one record per lead, server-side on your own domain, from the first touch to the closed deal. Five models on every plan, live in 21 minutes.