
















BlogB2B Marketing Attribution
B2B Marketing Attribution: Models, Data and Revenue (2026)
A B2B deal closes months after the click, is bought by a committee and is recorded in the CRM rather than in any ad platform. This guide covers the whole discipline: what B2B marketing, revenue and sales attribution each credit, lead-level against account-level architecture, pipeline stages as conversions, what your CRM does on its own, build or buy, and a seven step implementation.

Contents
Summarise this article with AI
Opens the page with a ready prompt in:


Nothing is sent until you pick a service.
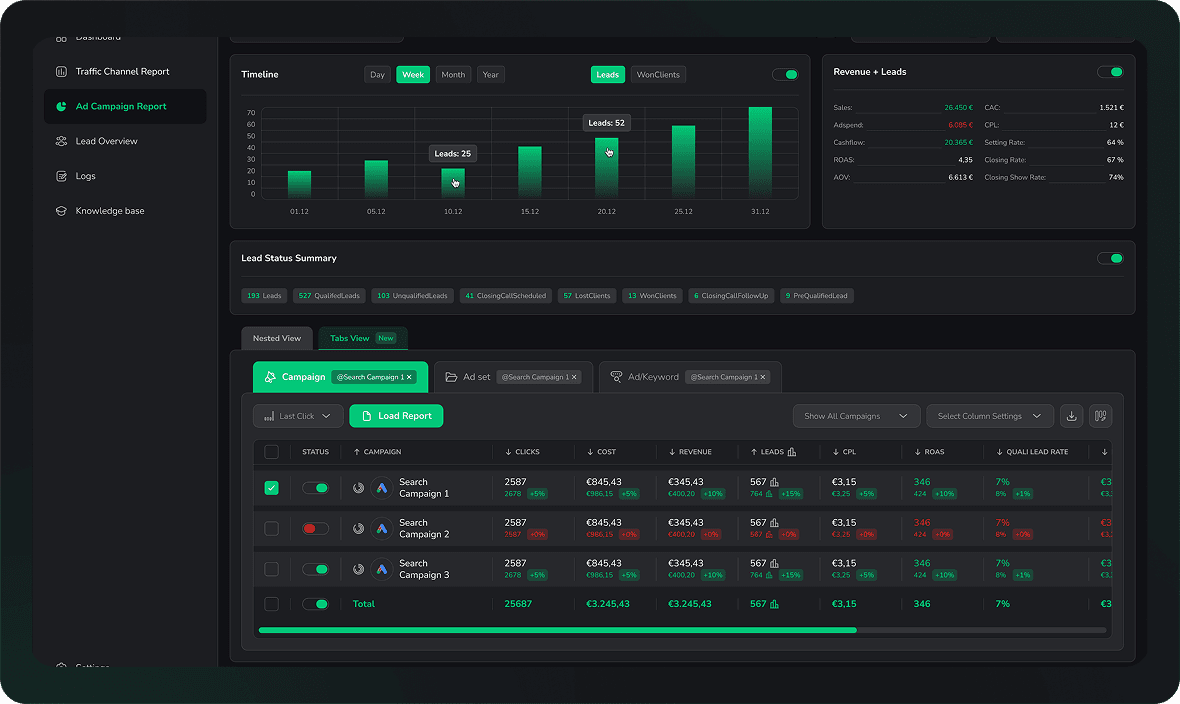
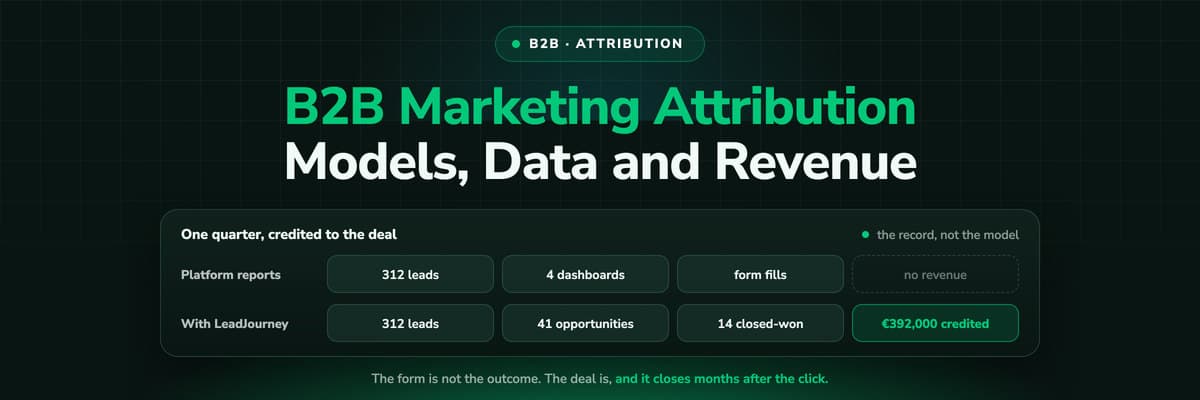
Here is a quarter of a B2B software company's marketing, invented for this guide so the arithmetic can be checked, but ordinary in its shape. €54,000 of spend across four platforms: €24,000 on Google Ads, €18,000 on LinkedIn Ads, €9,000 on Meta and €3,000 on Microsoft Advertising. Out of it came 312 leads, of which sales qualified 96. Those became 41 opportunities worth €1,148,000 of pipeline, and by the end of the quarter 14 of them had closed for €392,000.
Every number in that paragraph lives in a different system. The spend is in four ad accounts. The leads are in a form tool or a marketing automation platform. The qualified leads, the opportunities and the closed deals are in the CRM, months apart, each stage set by a different person. B2B marketing attribution is the work of joining those systems into one record per buyer, so that the €392,000 can be traced back to the clicks that started it and the next €54,000 can be spent on the channels that produced it.
This guide is the whole discipline rather than one corner of it. It covers what B2B marketing, revenue and sales attribution each mean, why B2B is a different measurement problem from a shop, the architectural choice between tracking a named lead and tracking an account, pipeline stages as the conversion ladder, what your CRM can do on its own, whether to build or buy, a seven step implementation and what changes at enterprise scale. The five attribution models get a short section and a link, because two other guides here already cover them in depth.
Quick Summary: B2B Marketing Attribution in One Paragraph
In short
B2B marketing attribution is the practice of crediting closed CRM revenue, not form fills, to the marketing and sales touchpoints that produced it, across a buying committee and a sales cycle that runs for months. The hard part is the record, not the model. A B2B deal is bought by several people, closes long after the first click and is recorded in the CRM rather than in any ad platform, so attribution only works when every click is captured first-party at the first visit, joined to a person at the form, call or booking, and carried through the pipeline stages to the closed amount. Every tool in the category makes one architectural choice: it follows a named lead or it models an account. LeadJourney is lead-level, from the click through the CRM stages to the closed deal, with five models switchable on every report, at 95%+ tracking accuracy and a 21 minute setup.
It is written for the people who have to defend a B2B marketing budget with CRM numbers: marketing leaders, demand generation and RevOps teams at software and services companies, and the agencies that run paid channels for them. If you already run multi-touch attribution and want the models compared, the B2B multi-touch guide is the shorter read. If your question is why the pipeline report and the ad dashboards disagree at all, start here.
What Is B2B Marketing Attribution?
B2B marketing attribution is the method of assigning credit for a business-to-business sale to the marketing touchpoints that contributed to it: the ads, searches, content, emails and events a buyer encountered between first hearing of a vendor and signing a contract. The definition is the same as in any other market. What changes in B2B is the thing being credited. It is not a purchase made in one session by one person, it is a CRM deal, reached through a pipeline of stages, by a group of people, over a period measured in months.
That changes the mechanics completely. A shop can attribute an order to a session because the order happens in the session. A B2B company has to attribute a deal to sessions that happened a quarter earlier, on several devices, by several colleagues, most of whom never filled in a form. The credit has to travel from an ad platform, through a website, into a CRM, and wait there until the deal closes. Every method and every tool in this guide is a way of making that journey hold.
Three phrases get typed into Google for this, and they are three emphases on one discipline rather than three disciplines. It is worth being precise about them, because a tool that is strong on one is often silent on another, and a buyer who asks for the wrong one gets a demo of the wrong report.
- B2B marketing attributionCredits the marketing touchpoints: the ad click, the organic search, the webinar, the email. The question is which marketing activity earned the deal, and the output is a channel and campaign report.
- B2B revenue attributionPuts the closed amount at the centre. The unit credited is euros from won deals rather than leads or conversions, so a channel with cheap leads and no revenue looks like what it is.
- B2B sales attributionCounts sales touches as touchpoints too: the discovery call, the demo, the email sequence, the meeting. The question is which combination of marketing and sales activity moved the deal to closed-won.
One discipline, three emphases
Marketing attribution asks which touches, revenue attribution asks how much they earned, sales attribution asks the same of the calls and meetings. A working setup answers all three from the same record.
Why B2B Attribution Is a Different Problem
Most attribution writing assumes an e-commerce shape: one buyer, one session, one order, a conversion pixel that fires when the money moves. B2B breaks every one of those assumptions, and the breakages are what make the discipline its own subject rather than a variant of conversion tracking. Four of them matter more than the rest, and each one removes a shortcut that works perfectly well for a shop.
A committee buys, not a person
Gartner's research puts the typical B2B buying group at six to ten people. One of them fills in the form. The others read, compare and object without ever identifying themselves.
The cycle runs for months
The click that started a deal and the signature that ended it can be a quarter apart. A seven day browser cookie has forgotten the first touch long before the second pipeline stage.
Half the touches are offline
Calls, demos, meetings, a conversation at an event, a referral from a customer. None of them fires a pixel, and all of them move deals. The record has to hold them beside the clicks.
The outcome is a deal, not a form
A form fill is where the anonymous visitor becomes a lead, not where the value is created. Value arrives at closed-won in the CRM, months later, at an amount no ad platform ever sees.
The last one has a consequence that the rest of this guide keeps returning to: the CRM is the system of record. Not the ad platform, whose conversion is a form fill inside its own window. Not the analytics tool, whose user is a browser. The CRM is the only system that knows a deal was qualified, opened, negotiated and won, and what it was worth, so any attribution that does not end in the CRM is attributing a proxy for the thing that pays the bills.
None of this is an argument about last click. The two multi-touch guides here already make that case, and it is a true one. The B2B argument is one step earlier: before any model can split the credit, the record has to reach from the first anonymous click to the closed deal, across the people, the months and the offline touches in between. A perfect model over a record that stops at the form is a perfect model of the wrong thing.
Lead-Level vs Account-Level Attribution: The Architectural Choice
Every B2B attribution product makes one decision before any other, and it shapes what the product can and cannot see: the unit it tracks is either a named lead or an account. Vendors do not always say which, and buyers rarely ask, so a great deal of the disappointment in this category comes from buying one architecture while needing the other. It is worth settling before the first demo.
Lead-level attribution follows a person. A visitor arrives from a click, is tracked first-party as an anonymous visitor, and becomes a named lead at the form, the call or the booking. Everything the visitor did before that moment is attached to the person, and the person is attached to the CRM deal they sit on, so the deal inherits the journey. Account-level attribution follows a company. It identifies the organisation behind anonymous visits, puts every stakeholder's touches on one company timeline, and credits the opportunity on that account from the combined record, including people who never filled in anything.
The two architectures side by side
| Architecture | What it tracks | Identity | Needs | Best when | Products built this way |
|---|---|---|---|---|---|
| Lead-level | One named person's journey, from the first anonymous click through the form to the CRM deal that person is on | A first-party visitor id and the platform click ids, resolved to a person at the form, call or booking | Server-side tracking on your own domain, a CRM connection, an afternoon | Inbound and paid funnels where the buyer identifies at a demo request; teams that want public pricing and a fast setup | LeadJourney; the CRMs' own tools (HubSpot's attribution reports, Salesforce Campaign Influence) |
| Account-level | Every stakeholder's touches on one company timeline, anonymous visits included once they are matched to a company | The company, identified behind the anonymous visit and joined to the CRM account and its opportunities | Usually a RevOps team and an annual contract, a tidy CRM with account and contact role hygiene, often a warehouse | Many anonymous stakeholders per deal, ABM programmes, six figure deals, long committee sales | Dreamdata, HockeyStack, Factors.ai, Adobe Marketo Measure |
Account-level is the right answer more often than a lead-level vendor would like. If your deals are six figures, your buying committee is large and mostly anonymous, and marketing runs account-based programmes against a named target list, then the thing you need to see is the account's timeline, and only a product that identifies companies can draw it. That is a real capability and it is worth paying for when the deal shape demands it.
Four products are built that way. Dreamdata models the whole account journey and identifies the companies behind anonymous visits, with audiences built from that model and synced to the ad platforms. HockeyStack resolves an enterprise's CRM, ad, ABM and warehouse sources into one dataset, with stakeholder maps, account scoring and an AI analyst inside Slack. Factors.ai identifies visiting companies, scores them and steers LinkedIn and Google Ads at them. Adobe Marketo Measure writes every-touch attribution into Salesforce or Microsoft Dynamics, with BDR and sales activities as touchpoints. Three of the four sell on quote to organisations with a RevOps team; Factors.ai publishes a price list by tracked users from $199 a month.
Lead-level is the right answer for the larger number of B2B companies whose buyer does identify. If demand arrives through paid search, paid social, content and referrals, and the decisive moment is a demo request, a trial signup or an inbound call, then the person who converted is the person whose journey matters, and the deal they open in the CRM is the outcome. That architecture needs no company identification, sets up in an afternoon rather than a quarter, and is what public per-month pricing is possible on. Its limit is stated plainly in the LeadJourney section below: it sees the named lead's journey, not the anonymous colleague's.
The test is one question: at the moment your CRM opens an opportunity, how many of the people who influenced it have already identified themselves on your site? If the answer is most of them, track leads. If the answer is one out of eight, track accounts. The comparison pages for Dreamdata, HockeyStack, Factors.ai and Adobe Marketo Measure run that question against each product row by row, and say where the account-level product wins.
Pipeline Stages as Conversions: The B2B Revenue Analytics Report
In e-commerce there is one conversion and it is the order. In B2B there are four, and they are the stages of the pipeline: the lead (a person identified at a form, call or booking), the qualified lead (sales agreed they fit), the opportunity (a deal opened with an amount) and closed-won (the contract signed and the amount real). Each is a conversion in the strict sense, an event with a date that a marketing touch can be credited for, and each one is set by a different person in a different week.
Treating those stages as the conversion ladder is what turns attribution from a marketing report into revenue analytics. The report is the funnel by channel with money at both ends: what each channel cost on the left, what its leads became stage by stage across the middle, and what they were worth at closed-won on the right. Here is the quarter from the introduction laid out that way, each lead credited to the channel of its first click.
One quarter, the funnel by channel, each lead credited to the channel of its first click
| Channel | Spend | Leads | Qualified | Opportunities | Closed-won | Revenue |
|---|---|---|---|---|---|---|
| Google Ads | €24,000 | 148 | 44 | 18 | 6 | €156,000 |
| LinkedIn Ads | €18,000 | 71 | 31 | 15 | 6 | €182,000 |
| Meta Ads | €9,000 | 74 | 15 | 5 | 1 | €26,000 |
| Microsoft Ads | €3,000 | 19 | 6 | 3 | 1 | €28,000 |
| Total | €54,000 | 312 | 96 | 41 | 14 | €392,000 |
Read the Meta and LinkedIn rows against each other. Meta produced 74 leads for €9,000 and LinkedIn 71 for twice the money, so on a cost per lead report Meta is the channel to scale. Then follow the rows to the right. Fifteen of Meta's leads qualified and one closed; thirty-one of LinkedIn's qualified and six closed, for seven times the revenue. The lead count told the opposite of the truth, and the only way to know was to carry each lead through the stages it reached.
Dividing the spend by each stage gives the unit economics per channel, and the further right you go the more the ranking changes. Every figure here is the spend divided by the count in the table above, rounded to the euro, and the last column is the revenue divided by the spend.
Cost per stage and return by channel, computed from the table above
| Channel | Cost per lead | Cost per qualified lead | Cost per closed deal | Revenue per euro spent |
|---|---|---|---|---|
| Google Ads | €162 | €545 | €4,000 | 6.5x |
| LinkedIn Ads | €254 | €581 | €3,000 | 10.1x |
| Meta Ads | €122 | €600 | €9,000 | 2.9x |
| Microsoft Ads | €158 | €500 | €3,000 | 9.3x |
| All channels | €173 | €563 | €3,857 | 7.3x |
Meta has the cheapest lead and the most expensive closed deal on the account, three times LinkedIn's. Microsoft, the smallest line item, has the cheapest qualified lead and returns more than nine euros per euro. Neither fact is visible in any ad platform, because no ad platform knows which of its conversions qualified, opened or closed. This is the report the phrase B2B revenue analytics is reaching for: not a dashboard of more metrics, but the same funnel your sales team runs, with the cost of each channel at the top of it and its closed revenue at the bottom.
Two practical rules follow. First, the stage names are the CRM's, not the tool's: if your pipeline says Discovery, Proposal and Negotiation, those are the conversions, and a tool that makes you rename them to its own vocabulary will be maintained by nobody. Second, the deal amount travels with the stage. A closed-won conversion without its value is a count, and the whole point of the ladder is that the right hand column is in euros. Lead quality by channel is the shorter statement of the same argument, and the true cost per lead works the arithmetic for a single channel.
With LeadJourney, we have finally found a tool that provides us with the data we need to scale our performance marketing campaigns. The most important KPI is no longer lead price but cost per qualified lead.
 Steffen SiesingCEO, Bilanzmanufaktur GmbH
Revenue Attribution vs Pipeline Attribution
The funnel above credits two different kinds of money, and they answer different questions at different times. Pipeline attribution credits the value of open opportunities to the touchpoints that produced them, as soon as the opportunity is opened. Revenue attribution credits the closed amount, and only once it has closed. In the quarter above, pipeline attribution has €1,148,000 to distribute across 41 opportunities the moment they are created; revenue attribution has €392,000 across 14 deals, and can only hand it out at the end.
During a long cycle, pipeline attribution is the operating report. A channel whose clicks in January become opportunities in February is doing its job, and a team that waits for closed revenue before judging it will judge it in May, two budget cycles too late. By first click, the €1,148,000 of pipeline in the example splits into €510,000 opened by LinkedIn Ads, €468,000 by Google Ads, €95,000 by Meta and €75,000 by Microsoft, and that ranking is available in week six of the quarter rather than week thirteen.
Revenue attribution is the audit. Pipeline is a promise, and some channels produce promises that do not close: a channel that opens large opportunities with a low win rate looks excellent on pipeline attribution and ordinary on revenue attribution, and only the second report catches it. The disciplined setup runs both on the same record, reads pipeline weekly to steer and revenue quarterly to correct, and keeps the deal amount on the record so the two reports are the same money at two dates rather than two estimates. The glossary entry on revenue attribution has the compact definition.
Revenue attribution also has a dimension pipeline attribution mostly lacks: the model. Once €392,000 has closed, the question of which touchpoints earned it has several defensible answers, and a B2B journey with five or more touches makes them diverge sharply. Here is the same closed revenue credited three ways. The first click column is the funnel table's revenue column, because that table credited each lead to the channel that opened its journey. Organic search and direct appear as a row, because in the example every journey was opened by a paid click but many ended on a brand search or a typed URL.
€392,000 of closed revenue credited under three models, each column summing to the total
| Channel | First click | Last click | Linear |
|---|---|---|---|
| Google Ads | €156,000 | €198,000 | €164,000 |
| LinkedIn Ads | €182,000 | €74,000 | €128,000 |
| Meta Ads | €26,000 | €38,000 | €46,000 |
| Microsoft Ads | €28,000 | €14,000 | €20,000 |
| Organic search and direct | €0 | €68,000 | €34,000 |
| Total | €392,000 | €392,000 | €392,000 |
LinkedIn earns €182,000 under first click and €74,000 under last click, because it opens journeys that Google's brand search and a direct visit close. Google Ads moves the other way, from €156,000 to €198,000, for the same reason seen from the other end. Linear sits between them and is the honest default when nobody can defend a weighting. What matters is not which column is right but that the total is the same in all three: once the credit is split from one record, the argument moves from whose number is true to which split of one true number best describes the journey.
B2B Sales Attribution: Where Marketing Credit Ends
In the funnel above, marketing's influence does not stop at the lead. Between the qualified lead and the closed deal sit a discovery call, a demo, two proposals, an email sequence and probably a conversation nobody logged, and each of those is a touchpoint in the same sense as the ad click. B2B sales attribution is the practice of counting them: putting the calls, meetings, emails and sequences on the same timeline as the marketing touches, so the record shows what moved the deal after it became a deal.
The enterprise tools have done this for a long time. Adobe Marketo Measure counts BDR and sales activities, calls, emails and meetings, as touchpoints alongside paid media, webinars and events, written into Salesforce or Dynamics. HubSpot's attribution reports count calls and meetings logged in the CRM among the interactions they credit. The value is real: a channel whose leads need three demos to close is a more expensive channel than one whose leads close after one, and only a record that holds the sales touches can show that.
The trap is as old as the practice. The last touch before closed-won is nearly always a sales touch, because the signature follows a meeting, so any model that leans on recency hands the credit to the rep who happened to run the final call. Under last touch, marketing's contribution to a six month deal evaporates into the closing meeting. Under a time decay model with a short half-life, it fades to a rounding error. The rep did their job; the model simply stopped looking at the four months before the rep was involved.
The fix is structural rather than a matter of modelling: keep the marketing and sales touches on one record, and report them as two layers rather than one contest. The marketing layer answers which channels produced and progressed the lead; the sales layer answers which activities moved the opportunity; and a model that credits across both should be read as a description, not a verdict on either team. In practice the deal record carries the source, the campaign and the first click beside the logged calls and meetings, and neither field overwrites the other when a rep updates the stage. The per-lead journey view is where that record is read: one person, every touchpoint of either kind, with its date.
Sales attribution also has the most honest limit in the discipline. Many of the sales touches that matter, the referral at a dinner, the call from a mobile, the colleague who forwarded the proposal, never reach any system. A record can hold what was logged; it cannot hold what was not. Getting reps to log calls and meetings is therefore an attribution project as much as a sales operations one, and the tools that make it automatic, call tracking with a number per campaign, a booking link that writes to the CRM, earn their place on that ground alone.
The Attribution Models in a B2B Cycle
The five standard models are the same in B2B as anywhere else, and two guides here cover them in depth: multi-touch attribution for B2B works through each one against long cycles, and multi-touch attribution shows them as a switch on a report. What belongs in this guide is the question each model answers in a pipeline that runs for months, because in B2B the choice of model is really a choice of question.
- [First click](/glossary/first-click-attribution) answers where demand was created. In a committee sale it is the only model that consistently credits the non-brand search or the LinkedIn campaign that made the account aware of you, months before anyone converted.
- [Last click](/glossary/last-click-attribution) answers what the decided buyer touched on the way in. It is useful for landing page and form work and misleading for budget, because in B2B the last click is almost always brand search or direct.
- [Linear](/glossary/linear-attribution) answers which channels were present in journeys that closed, weighting none of them. It is the honest default over a long cycle, and the one to read first when nobody can defend a weighting.
- [Position-based](/glossary/position-based-attribution) answers what opened and what closed, with 40% each on those two and 20% across the middle. HubSpot's U shaped model is this shape, and it fits a funnel where creation and conversion are the two expensive moments.
- [Time decay](/glossary/time-decay-attribution) answers what was recent, on a half-life of seven days in HubSpot's version. Over a six month cycle it starves the first quarter of the journey, so it suits short cycles and retargeting analysis more than budget allocation.
The enterprise tools add shapes built around the pipeline milestones themselves. HubSpot's W shaped model puts 30% on each of three milestones and 10% across the rest, its full path model 22.5% on each of four with 10% between them, and its J shaped and inverse J models, at 20/60/20 and 60/20/20, move most of the weight to one milestone. Adobe Marketo Measure runs U shaped, W shaped, full path, first touch and lead creation simultaneously and adds custom weightings. These answer a stage question, which touch preceded each milestone, and they only work on a record that holds the milestones, which brings the discipline back to where it started.
Whatever the model, the useful reading is the same: switch it and watch which channels change rank. A channel that holds under every model is genuinely performing, and one that only wins under last click is being paid for demand another channel created. That comparison is only made if switching costs nothing, which is an argument about the report rather than about the model. See attribution model for the compact definitions of all of them.
What Your CRM Can Do on Its Own
Before buying anything, it is worth knowing exactly what the systems you already pay for will attribute, because the honest answer is more than nothing and less than the sales deck suggests. Four of them come up in every B2B evaluation, and each attributes what it can see and nothing beyond it.
HubSpot
HubSpot has the most complete attribution of the three CRMs. Marketing Hub ships nine models (linear, first interaction, last interaction, U shaped, W shaped, full path, J shaped, inverse J and time decay on a seven day half-life), and contact create attribution is available from Marketing Hub Professional. Deal create attribution and revenue attribution, the reports this guide is about, need Marketing Hub Enterprise. Every report buckets interactions by the session HubSpot's tracking code recorded in the browser, so a visitor who declined the analytics cookie category contributes nothing.
Two more limits matter for paid channels. Only the gclid is captured natively; fbclid, li_fat_id and msclkid need a hidden field and your own script. Ads ROI is estimated from an average sale price and a contact-to-customer rate rather than measured from deals, and conversions sent back to the platforms carry a fixed value you type per event, not the deal amount. HubSpot Marketing Hub attribution explained has the detail, and the best attribution tools for HubSpot covers what sits in front of it.
Salesforce Campaign Influence
Salesforce answers a different question. Customizable Campaign Influence, in the Professional, Enterprise, Performance, Unlimited and Developer editions, credits an opportunity across the campaigns its contact roles are members of, on a predefined model or on percentages you enter, within an auto-association time frame you set. It is a good tool for the question it asks. It knows nothing about a click that never became a campaign member, so the ad, the organic search and the anonymous visit are outside it unless something else wrote them onto a campaign. Salesforce Campaign Influence explained covers the setup and the best attribution tools for Salesforce the tools that feed it.
Pipedrive
Pipedrive has no attribution models and no ad spend anywhere in the product. Insights will report won value by any field on the deal, including a source field a rep picks from a list, which is a real report if the field is maintained and a fiction if it is not. Everything else comes from the tool placed in front of it, and the best attribution tools for Pipedrive ranks them by what they write onto the deal.
LinkedIn's Revenue Attribution Report
Not a CRM, but it appears in the same conversations. The Revenue Attribution Report lives in LinkedIn Business Manager, needs a Business Manager admin, connects Salesforce, Dynamics 365 or HubSpot by OAuth, and reports revenue won, return on ad spend, pipeline amount, leads, open and closed-won opportunities, win rate, average deal size and average days to close. Its influence is impression-based or engagement-based, over a lookback window of 30 to 365 days (180 by default) and a configurable number of touchpoints.
Two things to understand before quoting it in a budget meeting. It reports LinkedIn's influence only, with no view of Google, Meta or organic. And influenced means the account touched LinkedIn inside the window, not a split of credit: a deal can be influenced by LinkedIn under this report and be credited, by every model in the previous section, to something else. The LinkedIn Ads integration is the version of this loop where the deal value goes back to LinkedIn matched on the click.
What all four share
Each attributes what it can see: a session its own code recorded, a campaign membership, a field a rep filled, an impression on its own platform. None holds the first anonymous click, the click ids and the closed amount on one record.
Build or Buy: The Warehouse Route and the Platform Route
Every B2B company with a data team considers building this. The plan is always the same: the GA4 BigQuery export for the touchpoints, the CRM's own export for the stages and amounts, a cost pipeline from the four ad platforms, and dbt to join them into a model the BI tool can read. It is a reasonable plan, and it is worth knowing where it runs into the ground before committing a quarter of an analyst to it.
The GA4 export is the weak link, for reasons the BigQuery attribution guide works through in SQL. It carries no cost or spend field, so cost per qualified lead has nothing to divide by until a second pipeline pulls spend from Google, Meta, LinkedIn and Microsoft on their own schedules and joins it on campaign names as each platform spells them. Its conversions are, in Google's own description, last click observed with no modelling, so the modelled conversions in the GA4 dashboard never reach the warehouse and the two will never agree. Its identity is a browser rather than a person, and it has never heard of your CRM.
There are teams that should build anyway. If you already run a warehouse with the CRM and the ad platforms in it, have an analyst who owns the models, need attribution joined to product usage or billing data no vendor holds, or sell in a way no packaged tool's stage model fits, then the build is a few weeks on top of infrastructure you already pay for and the result is yours. The honest test is whether the warehouse and the pipelines exist today. If the attribution project is the reason to build them, the platform route is cheaper by an order of magnitude and live this week.
The two routes are no longer exclusive. A platform that streams its own rows into your warehouse gives the data team the raw material without the collection problem. LeadJourney's BigQuery export writes raw clicks, conversions and leads into your own dataset, each click already carrying the campaign, the click id and the conversion it reached, so the join the GA4 export makes impossible is already done on the row. The marketing team gets the reports on Monday; the analysts get the same rows for the questions no report answers.
How to Implement B2B Marketing Attribution in Seven Steps
Seven steps, in the order the data depends on itself. A team that starts at step six builds a model over a record that cannot carry it, and the touches not collected in the first quarter are not available in the second. Each step is two sentences here and a page of its own elsewhere on the site.
- Capture the journey server-side, on your own domain. A browser pixel loses a share of every channel's clicks to Safari, iOS, ad blockers and consent tooling, and loses them unevenly, which biases every comparison downstream. Server-side tracking with an identifier set by your own domain and kept on the server is what puts the accuracy in the nineties.
- Read the click ids at the first visit and keep them. gclid with gbraid and wbraid, fbclid, li_fat_id, msclkid and ttclid, plus the UTM parameters and the landing page, read once at the first visit and stored against one visitor id that survives weeks and months. How the gclid is captured and stored is the long version.
- Resolve the visitor to a person at the form, the call or the booking. That is the moment the anonymous journey gets a name, and everything the same visitor did before it, on any device, attaches to the lead. Without this step there is a journey and a lead and no link between them.
- Write the source onto the CRM contact and the deal. The channel, campaign, ad and landing page belong in fields on the record in HubSpot, Salesforce, Pipedrive or whatever you run, where a sales manager can filter them. A source that lives only in a reporting tool is not trusted by the people who close the deals, and the CRM lead source is where that trust is won or lost.
- Make the pipeline stages the conversions, with the deal amount on each. Qualified, opportunity and closed-won are the conversions the model credits, named as your CRM names them, and the amount travels with the stage. This is the step that turns a cost per lead report into revenue attribution.
- Choose a model per question, and keep it switchable. First click for where demand was created, linear as the default, position-based for the two expensive moments, on the same report with a switch rather than a re-import. The comparison between models is where the insight is, and it only happens if switching costs nothing.
- Send the closed stages back to the platforms. Once the record knows which leads qualified and closed, those stages go back to Meta, Google, LinkedIn and Microsoft as conversions with the deal value, so the platforms optimise toward deals rather than form fills. Optimising on revenue is what this step buys, and it is the one that makes the rest pay for itself.
Steps one to four are the record and cannot be retrofitted: the data you did not collect in March is not available in June. Steps five to seven are the reporting and can be changed in an afternoon. The order is the whole method, and it is also why a tool should be judged on how it does the first four before anyone looks at the models in the sixth.
B2B Attribution at Enterprise Scale
Above a certain size the questions change. A group with several brands, markets or business units does not need attribution; it needs one attribution standard, so that a euro of pipeline in the German subsidiary means the same thing as a euro in the British one and the board sees one report rather than five. That means one stage model across the units, one set of models switchable on every report, and one place where a RevOps team can see every unit without logging into each.
Then the procurement questions, which in the EU come before the technical ones. Where is the data hosted: LeadJourney's is in Frankfurt. Is there an Article 28 data processing agreement: yes, and the vendor security review a procurement team runs is supported. Of the four account-level platforms in the earlier table, Dreamdata publishes data centres within the European Union, Factors.ai publishes a hosting zone in the United States, and the other two publish no region on their sites, so the question has to be asked rather than assumed. Ask it of every vendor, including us.
The third set of questions comes from the BI and RevOps team, who will not read attribution in a vendor's dashboard: they will pull it into their own. That needs an API, a warehouse export and, increasingly, an MCP connection so an analyst can ask a model to query the workspace directly. LeadJourney's BigQuery export streams raw clicks, conversions and leads into the customer's own dataset, and the MCP server lets Claude or ChatGPT query a workspace. Snowflake is on the roadmap and is not claimed here.
Finally the contract and the SLA, which a public per-month price does not by itself provide. The enterprise page sets out how a multi-entity standard, the DPA, the security review, the API and MCP access and the contract fit together. What it does not claim is a SOC 2 report, an ISO 27001 certificate or a HIPAA business associate agreement; a procurement team that needs one of those should say so at the first call rather than the last.
How LeadJourney Does B2B Attribution
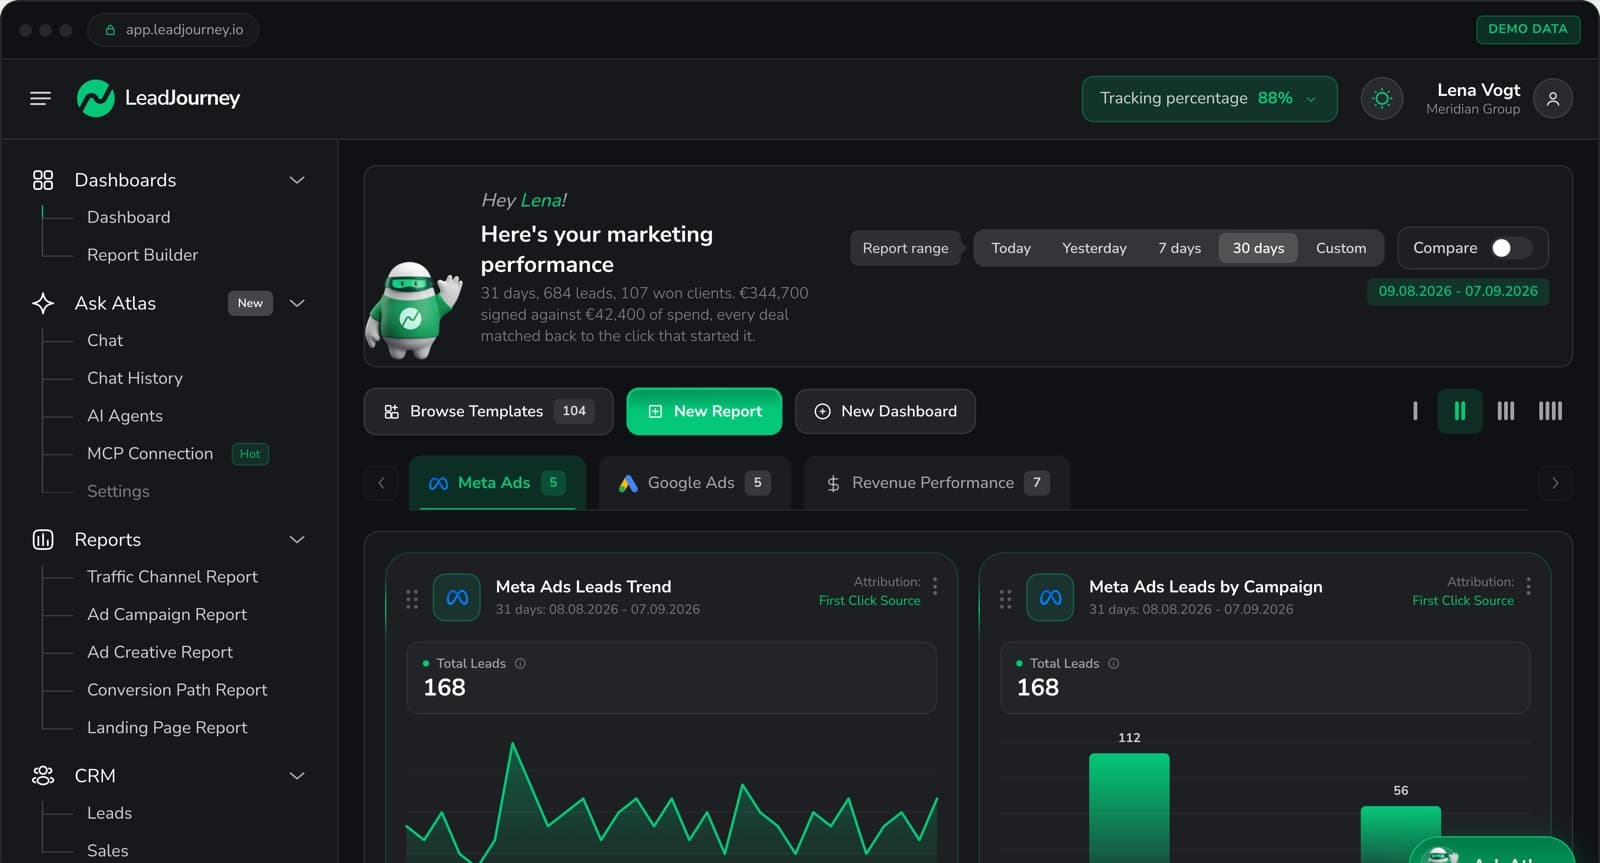
LeadJourney is an all-in-one attribution platform for lead generation, B2B SaaS, e-commerce and the agencies that run marketing for them; this section is about what it does for a B2B cycle. Tracking runs server-side on your own domain at 95%+ accuracy. The click ids are read at the first visit and kept, gclid with gbraid and wbraid, fbclid, li_fat_id, msclkid and ttclid, together with the UTM parameters and the landing page, all stored on the LeadJourney Click ID: an identifier of our own for one visitor, set on the first visit, kept in the browser for weeks or months, with every later session appended to it. That is what lets a click in January and a form in March be the same person.
At the form fill, the call or the booking the visitor becomes a named lead, and from there the record follows your CRM stages to the closed deal: natively on HubSpot, Salesforce, Pipedrive, Close, Attio, GoHighLevel, ActiveCampaign and Odoo, and by webhook, Zapier, Make, n8n or the API on anything else. Closed revenue is credited back across the touchpoints under first click, last click, linear, position-based or time decay, switchable on the channel report, the campaign report and the landing page report, on every plan. The per-lead journey view shows one person's touchpoints with their dates, the AI search engines are sources in their own right, and Atlas, the AI analyst, answers questions about the workspace.
The loop closes the other way as well. CRM stages and closed deals go back to Meta, Google, LinkedIn and Microsoft as conversions with the deal value, on every plan, so the platforms optimise toward the leads that closed. And the honest sentence this guide promised: LeadJourney is lead-level attribution, not account-level. It follows the named person who identified and joins them to the deal; where a deal has several contacts, each contact's journey sits on the deal's record, but it does not identify anonymous companies, model a buying committee across stakeholders who never converted, or run marketing mix or incrementality models.
For an inbound or paid B2B funnel where the buyer identifies at the demo request, that is the architecture that fits; for a mostly anonymous committee, the account-level section above names the products built for it. Setup takes about 21 minutes, from €129 a month, with a 14-day free trial and no credit card, and the whole product is clickable on demo data in the live demo before anyone talks to sales.
Further Reading
The models in depth: multi-touch attribution for B2B and multi-touch attribution for B2B lead generation. The channel question: cross-channel attribution and the best cross-channel attribution tools. The buyer's side of the record: the B2B buyer journey.
What the CRMs do and what sits in front of them: attribution tools for HubSpot, for Salesforce and for Pipedrive, with HubSpot Marketing Hub attribution and Salesforce Campaign Influence explained. The account-level products, row by row: Dreamdata, HockeyStack, Factors.ai and Adobe Marketo Measure. On the product side, attribution for enterprises, attribution for SaaS companies and the marketing attribution software category page.
FAQ
Frequently Asked Questions
What B2B marketing and RevOps teams ask before rebuilding how a deal is credited.
What is B2B marketing attribution?
B2B marketing attribution is the practice of crediting a business-to-business sale, recorded as a deal in the CRM, to the marketing touchpoints that contributed to it: the ad clicks, searches, content, emails and events a buying group encountered between first hearing of a vendor and signing. It differs from consumer attribution in what is credited and how long it takes. The outcome is a CRM deal rather than an order, it is reached through pipeline stages over months, and several people influence it while only one or two identify themselves. The method therefore has to capture the first anonymous click, join it to a person at the form, and carry it through the CRM to the closed amount.
What is the difference between B2B marketing attribution and B2B revenue attribution?
They are two emphases on one discipline. Marketing attribution asks which marketing touchpoints contributed to a deal and produces a channel and campaign report. Revenue attribution asks how much closed revenue each of those touchpoints earned, so the unit credited is euros from won deals rather than leads or conversions. In practice a marketing attribution report that stops at leads can rank channels backwards: in the example in this guide, the channel with the cheapest leads had the most expensive closed deals. Revenue attribution is the version of the report where the right hand column is in euros, and it needs the deal amount carried on the record from the CRM.
What is B2B sales attribution?
B2B sales attribution counts sales activities as touchpoints in the same record as the marketing touches: the discovery call, the demo, the meeting, the email sequence, the proposal. Tools such as Adobe Marketo Measure count BDR and sales activities beside paid media and events, and HubSpot's reports credit calls and meetings logged in the CRM. The value is seeing what moved a deal after it became a deal. The risk is the last sales touch absorbing the credit, since a signature almost always follows a meeting. The working practice is to keep both kinds of touch on one record and read them as two layers rather than one contest.
Lead-level or account-level attribution: which do we need?
Ask one question: when your CRM opens an opportunity, how many of the people who influenced it have already identified themselves on your site? If most have, because demand arrives through paid and inbound channels and the decisive moment is a demo request or a trial, lead-level attribution fits. It follows the named person from the first click to the deal, sets up in an afternoon and is what public pricing is possible on. If only one in eight has, because the deal is six figures and bought by a large, mostly anonymous committee, you need account-level attribution, which identifies companies behind anonymous visits and models every stakeholder on one timeline. Dreamdata, HockeyStack, Factors.ai and Adobe Marketo Measure are built that way; LeadJourney is lead-level.
Which attribution model is best for B2B?
None on its own, and the useful setup is a switch rather than a choice. Linear is the honest default over a long cycle because it weights nothing you would have to defend. First click is the one model that consistently credits the campaign that created demand months before anyone converted, so read it beside linear. Position-based fits a funnel where the opening and the closing touch are the two expensive moments. Last click is misleading for budget in B2B because the last click is nearly always brand search or direct, and time decay on a seven day half-life starves the first months of a six month deal. Watch which channels change rank when you switch; a channel that holds under every model is genuinely performing.
Can HubSpot or Salesforce do B2B attribution on their own?
Partly, and it is worth knowing exactly which part. HubSpot ships nine attribution models, but deal create and revenue attribution need Marketing Hub Enterprise, every report is bucketed by the session its tracking code recorded in the browser, a visitor who declined the analytics cookie category contributes nothing, and only the gclid is captured natively. Salesforce Campaign Influence credits an opportunity across the campaigns its contact roles belong to, on a model or on percentages you enter; it knows nothing about a click that never became a campaign member. Both attribute what they can see. Neither holds the first anonymous click, the four platform click ids and the closed amount on one record without a tool in front of them.
How long until B2B attribution shows results?
Two clocks run at different speeds. The setup is short: connecting the tracking, the CRM and the ad platforms takes about 21 minutes on LeadJourney and an afternoon on most modern tools. The data is as long as your sales cycle. Leads and qualified leads appear in the reports within days, pipeline attribution within the first weeks as opportunities open, and revenue attribution only once deals close, so a company with a three month cycle sees its first complete closed-loop quarter roughly a quarter after switching on. That is the reason to start now: the clicks not captured this quarter are not available next quarter, however good the model.
Keep reading
More from the blog
 B2B Marketing Attribution
Cross-Channel Attribution: What It Is and Why It Breaks
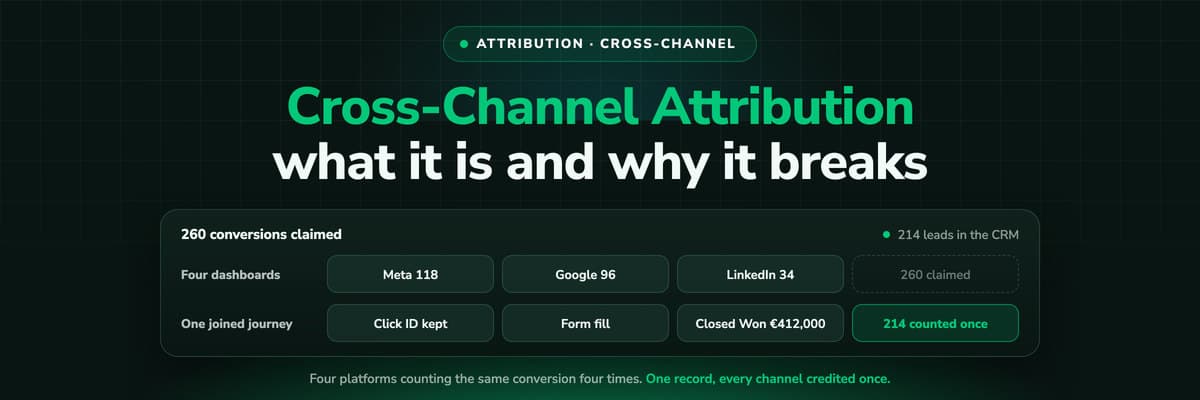
Meta claims 118 conversions, Google claims 96, LinkedIn 34 and Microsoft 12. The CRM has 214 leads. Cross-channel attribution is the work of turning four honest, incompatible answers into one, and this guide covers the four methods that try it, what each of them can and cannot see, and the setup that decides whether any of them holds.Read the article14 min read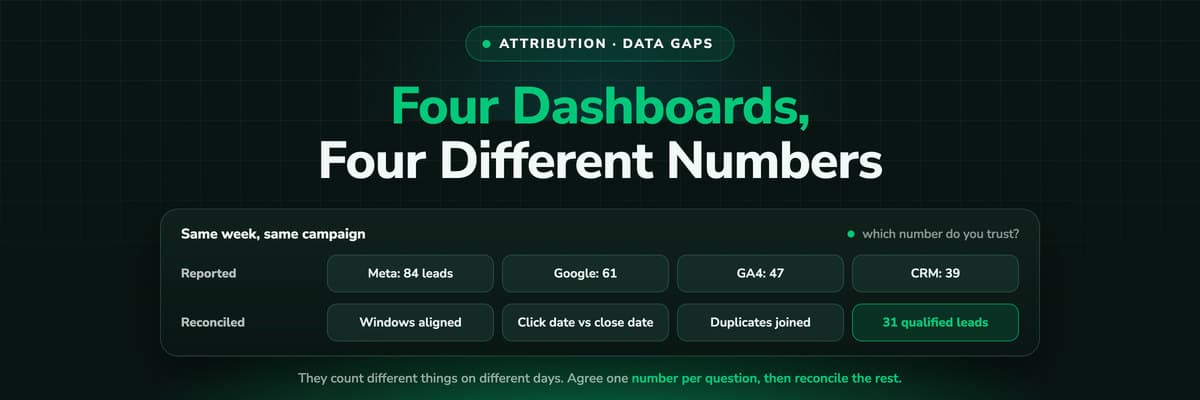 B2B Marketing Attribution
Why GA4, Meta and Google Never Agree With Your CRM
Four dashboards, four numbers, the same week, and somebody has to decide which one is real. The seven structural reasons the counts can never match, from attribution windows and view-through conversions to timestamps, identity and definition drift, then the useful half: which number to trust for which decision, and a reconciliation your team can run this week.Read the article13 min read B2B Marketing Attribution
Attribution for Long Sales Cycles: Crediting a Late Deal
Attribution windows were built for checkouts, so a 7 or 90 day window expires long before a nine month B2B deal closes. The four things you have to persist, why last click is useless here, the reporting cadence that makes a long cycle legible, and what to send back to the ad platforms and when.Read the article13 min read
From the click to the closed deal
Credit the deal to the click that started it, months later
LeadJourney captures every click server-side on your own domain, joins it to the lead at the form, follows your CRM stages to the closed deal and sends the revenue back to the ad platforms. Live in 21 minutes.