














BlogB2B Marketing Attribution
Why GA4, Meta and Google Never Agree With Your CRM
Four dashboards, four numbers, the same week, and somebody has to decide which one is real. The seven structural reasons the counts can never match, from attribution windows and view-through conversions to timestamps, identity and definition drift, then the useful half: which number to trust for which decision, and a reconciliation your team can run this week.

Contents
Summarise this article with AI
Opens the page with a ready prompt in:


Nothing is sent until you pick a service.
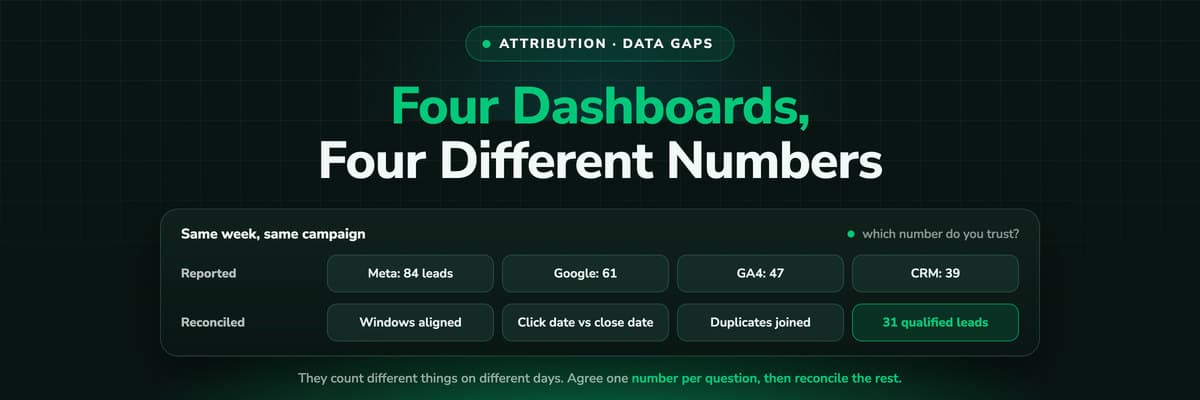
Meta says 84 leads last week. Google Ads says 61. GA4 says 47. The CRM has 39 records, of which sales calls 22 real. Four tools, one week, one set of campaigns, and four numbers that are not close enough to round together. Somebody says the tracking is broken, somebody else says the platforms inflate, and the budget decision gets postponed again.
The tracking is probably fine. Those four systems are not four measurements of one thing that disagree. They are four different measurements, of four different things, under four different rules, on four different dates. This is the reference for why that is structurally true, which number answers which question, and how to run a reconciliation that ends the argument.
Quick Summary: Why the Numbers Never Match
In short
GA4, Meta, Google Ads and your CRM will never show the same conversion count, and a setup that made them match would be broken. They use different attribution models and lookback windows, count view-through conversions differently, stamp a conversion on different dates, identify people at different levels, lose different data, model what they cannot see, and define a lead differently, so each one is answering a different question. The fix is not reconciling to a single figure. It is agreeing in writing which source answers which question, then joining platform spend to CRM outcomes on a click ID stored at the first visit.
Below: the seven reasons, a table of which number to trust for which decision, a reconciliation a team can actually run, and the governance point that stops this meeting repeating.
One Click, Four Counts
Follow one person. On Tuesday she sees your Meta ad on a phone, does not click, and that evening searches your brand on a laptop and clicks the Google ad. She reads two pages, leaves, returns nine days later from a newsletter and fills the form. Sales qualifies her three weeks after that, and the deal closes in November.
Meta may count a view-through conversion, dated Tuesday. Google Ads counts one also dated Tuesday, because that is when the click happened. GA4 counts one nine days later and credits the newsletter. The CRM records a lead nine days later, a qualified lead three weeks after that, and revenue in November. Every one is correct inside its own rules.
That single journey contains six of the seven reasons. The seventh, what the word lead means, causes the loudest arguments and gets fixed in a meeting rather than in a tool.
Reasons 1 and 2: Models, Windows and the View-Through
Reason 1: different attribution models and lookback windows
Each system decides for itself which touch earns credit and how far back it will look. None of it is standardised, and every default is tuned to the vendor's own product.
- Meta defaults to a 7-day click plus 1-day view setting, configurable per ad set, and only sees touches on Meta's own surfaces.
- Google Ads uses data-driven attribution for most conversion actions by default, with a conversion window set per action, commonly 30 days and adjustable.
- GA4 runs its own model over its own data, with its own lookback windows, and its acquisition reports use last non-direct click, which is a third rule again.
- The CRM has an implicit model nobody chose: whatever the lead source field held when the record was created, or what a salesperson typed.
Two consequences. A journey longer than a platform's window is invisible to it, which is why B2B accounts with a three-month cycle see the largest gaps. And because each platform sees only its own touches, a journey crossing Meta and Google is counted in full by both: not double counting inside either dashboard, but double counting the moment you add them up. See attribution window.
Reason 2: view-through and engaged-view conversions
Meta counts a conversion when somebody saw the ad and did not click, inside its view window. Google Ads has its own versions for Display, Video and Demand Gen in separate columns, including engaged-view conversions on video. GA4 counts none of it, because no click reached your site, and the CRM has no idea an impression happened.
On an account running upper funnel social this one reason can be most of the gap, and it is not fraud. It is a different definition of contribution. The rule: know which columns include view-through before you quote them, and never compare one that does against one that cannot.
Reasons 3 and 4: The Date and the Person
Reason 3: the click date against the conversion date
The reason most teams have never heard of, and it explains gaps that look like data loss. Ad platforms report a conversion back on the day of the click or impression that earned it. GA4 and your CRM report it on the day it happened. The same conversion lands in two different weeks.
For e-commerce with a same-day cycle that is noise. For lead generation with a two-month sales cycle it smears the curves apart, and a recent week in a platform dashboard is always incomplete: conversions are still being backdated into it. This week's Meta number against this week's CRM number compares a figure that will keep growing to one that will not.
The 30-day rule for any comparison
Never reconcile a period still inside an attribution window. Pick a week that finished at least a month ago, longer if your windows are longer. Half the gaps teams escalate are weeks that had not finished filling in.
Reason 4: deduplication and identity
Each system identifies a different unit. GA4 works with a browser identifier and a session, the ad platforms with a person inside their own logged-in graph, the CRM with an email address. A lead who opens the ad on a phone, researches on a work laptop and signs on a third device is one person to the CRM and three to the browser.
Deduplication differs again. Browser and server events must share an event id or they count twice, a duplicate submission may be one conversion and two CRM records, and a returning customer is a new conversion to the pixel and an existing contact to sales. See cross-device journeys for how much of this a stored click ID solves.
Reasons 5 and 6: Missing Data and Modelled Data
Reason 5: the data the browser never sends
A browser tag must load, run and reach a third-party endpoint before it counts anything, and four things stop it. Ad blockers block the request. Safari and iOS restrict cookie lifetimes, so a return visit weeks later has forgotten the first one. A declined consent banner means the tag never fires. And ordinary breakage, a tag missing from the thank you page or a redirect that drops parameters, is commoner than anyone expects.
This hits browser-measured numbers hardest, which is why GA4 usually sits below the platforms and often below the CRM. Server-side tracking on your own domain removes most of it, because the event leaves your server rather than the visitor's browser. The comparison is in server-side versus browser tracking.
Reason 6: modelling and thresholds
What a platform cannot observe, it estimates. Google Ads models conversions it believes happened but could not measure, including consent-declined and cross-device paths, and reports the estimate in the same column as the observed ones. GA4 applies its own modelling and withholds detail where the numbers are small enough to identify individuals, so a segmented report can total less than the unsegmented one.
None of that is dishonest, and a modelled figure is often closer to the truth than a raw count. But a model estimates a population, and a CRM record is a named person you can phone. Do not expect the two to reconcile row by row.
Reason 7: A Form Fill Is Not a Lead
The most human reason, and the one that produces the loudest meetings. The pixel was asked to count form submissions. Sales counts people worth calling. Finance counts signed contracts. All three call their number leads, and nobody has written down which one the reporting means.
The drift compounds. A submission that failed email verification is a conversion to Meta and nothing to the CRM. A prospect who filled two forms is two conversions and one contact. A lead typed in after a trade show is a CRM record with no click behind it. Before blaming a tool, take one week and count the CRM records with no ad click, and the platform conversions that produced no CRM record. That is usually the whole argument.
The fix is a written definition of qualified lead that sales agrees to, and one CRM stage that represents it. Everything downstream depends on that sentence existing.
Which Number to Trust for Which Decision
There is no single true number, and hunting for one is the mistake. There is a right instrument per question. Settle it once with this table.
The right source per question
| The question being asked | The source to trust | Why |
|---|---|---|
| Should I scale or cut this ad set today? | The platform's own conversion count | The algorithm optimises on what it can see, and a daily decision needs same-day feedback. Compare Meta to Meta, week to week, never across platforms. |
| What is my true cost per qualified lead? | Platform spend joined to CRM qualified leads | Only the CRM knows which submissions passed qualification. Spend comes from the platform, the numerator from the CRM, and neither dashboard does it alone. |
| What did marketing contribute to revenue? | The CRM, by close date, first and last touch side by side | Revenue is a CRM fact. The platforms count conversions rather than money received, and date them by click, which is the wrong axis for a quarter. |
| Is this landing page converting? | GA4 or your own site analytics | A page and session question, not a person question. The instrument that measures sessions is the right one, and platform attribution is irrelevant here. |
| Which channel starts the deals that close? | A journey record that keeps every touch | No platform sees touches that happened elsewhere. This needs a first-party record of the whole journey, not any single dashboard. |
| Did the platform receive the conversion at all? | The platform's event diagnostics | A delivery question about your own pipeline, not an attribution question. Check match quality and event volume before debating totals. |
Note what the table does not contain: a column reconciling the four totals. Nobody needs that number. Every real decision maps to one of these rows.
How to Run a Reconciliation That Ends the Argument
Once, properly, on one week and one campaign. The point is not to make the numbers equal but to name and size every reason they differ, so the next meeting starts from a shared list rather than a shared suspicion.
- Pick one campaign and one week that finished at least 30 days ago, so no window is still filling.
- Export the platform conversions for that week with both the click date and the conversion date, the click ID and the campaign.
- Export every CRM record created that week, plus every record whose first touch names that campaign, whatever week it was created in.
- Join on the click ID first, then hashed email, then phone number. Record which key matched: that alone tells you how good your identity chain is.
- Classify every unmatched row into exactly one of the seven reasons, one row per record, in a spreadsheet with a reason column.
- Count the classes and sort them. The largest is your next project, and the rest become footnotes in the monthly report.
The classification step is the whole value. A gap of 45 conversions is an argument. A gap made of 18 view-through, 12 outside the window, 9 with no click ID and 6 duplicates is a project plan, and only the click ID rows need fixing.
What a Healthy Gap Looks Like
A gap is not a symptom. A gap that behaves unpredictably is. Three things separate a setup working as designed from one that needs work.
- Healthy: stable and explainableThe platforms sit above the CRM by roughly the same proportion each month, the direction never flips, and most unmatched rows classify as window and timestamp effects.
- Broken: a step changeThe gap jumps on a particular date rather than drifting. That is a deployment, a consent banner change or a tag that stopped firing, and it has a cause you can find in a changelog.
- Broken: no click ID on the recordA large share of CRM records with no click ID means the identity chain never survived the journey. No reporting fixes that, because the join key was never stored.
The last is the common diagnosis in lead generation, and it is worth stating plainly: if the click ID is not captured at the first visit and carried onto the CRM record, no model or dashboard recovers it later. See pixel and CRM mismatch.
Agree One Number Per Question, in Writing
The technical half is a week of work. The governance half is an hour, and it is what stops the meeting repeating. Three numbers, defined in a document everyone can open, reviewed quarterly and never renegotiated in the meeting itself.
The optimisation number
What each ad platform counts, in its own dashboard, on its own model. For daily decisions inside that platform. Never compared across platforms and never added up.
The efficiency number
Cost per qualified lead: platform spend over CRM qualified leads, on one written definition of qualified that sales signed off. What the weekly meeting runs on.
The revenue number
Closed revenue from the CRM by close date, first and last touch shown together. Slow, always late, and the only one anyone outside marketing believes.
Write next to each one who owns it, which system it comes from and how often it refreshes. Then when somebody asks why Meta says 84 and the CRM says 39, the answer is that those are the optimisation number and the efficiency number, both correct, and the meeting moves on.
How LeadJourney Gives the Four Dashboards One Shared Record
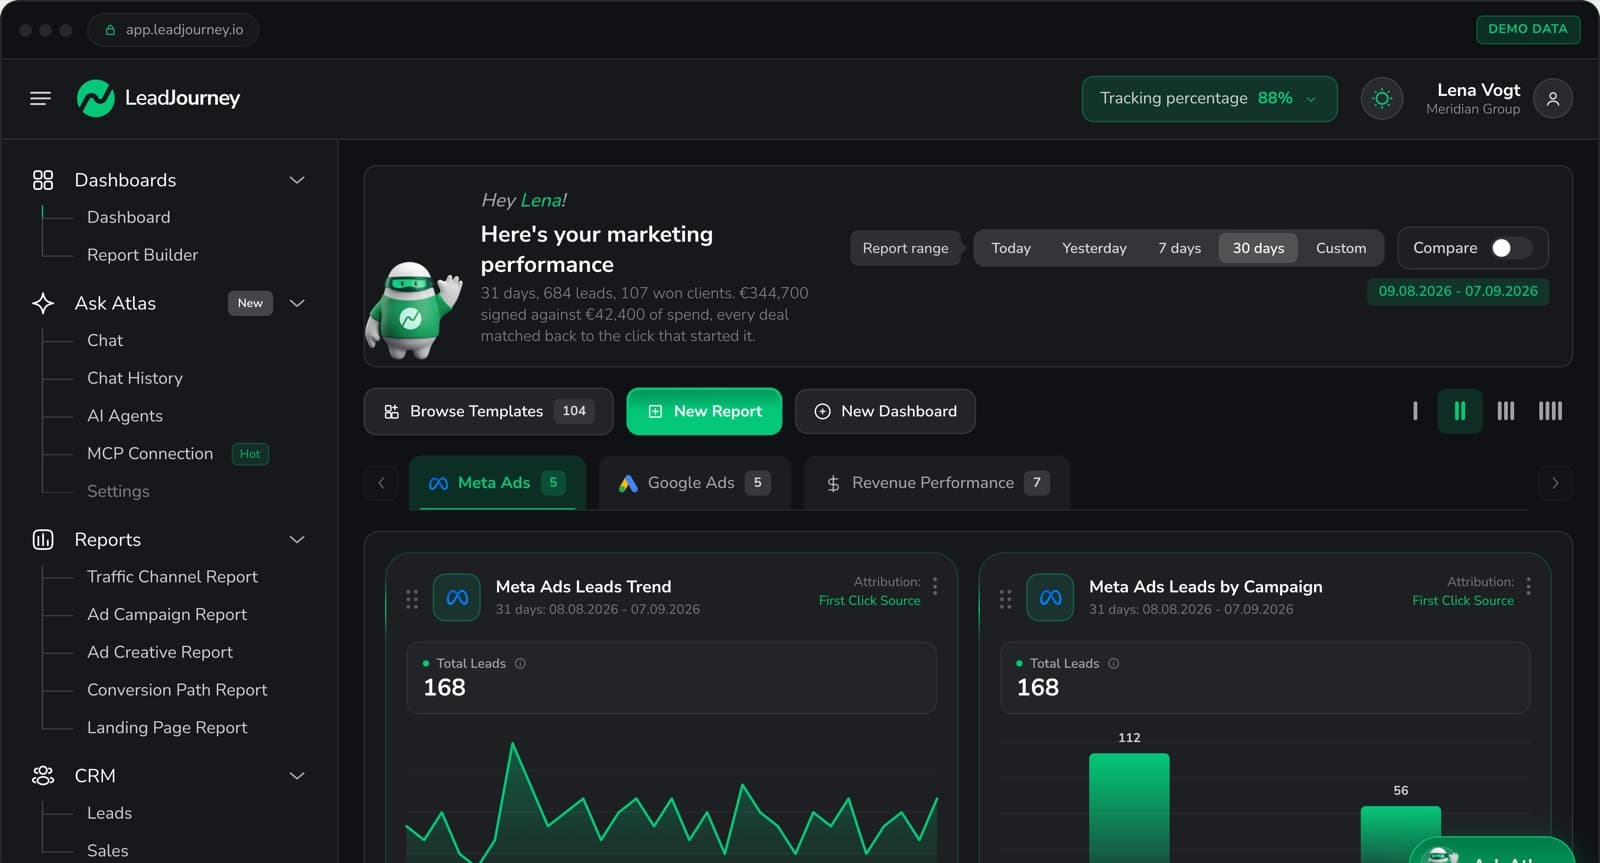
LeadJourney does not try to make the four numbers equal, and no honest tool would. It builds the record underneath them. Tracking runs server-side on your own domain at 95%+ accuracy, so most of reason five disappears, and the click IDs are captured at the first visit: gclid with gbraid and wbraid, fbclid, li_fat_id, msclkid, plus the UTMs and the landing page. That anonymous first click is joined to the person at the form fill, the call or the booking, and the journey follows your CRM stages to the closed deal.
Because the join key is stored rather than inferred, the reconciliation above stops being an annual exercise. Cost per qualified lead and cost per closed deal are standard reports, models switch between first click, last click, linear, time decay and position based without re-tracking, and no attribution window cuts a long cycle short. The CRM stages you choose go back to Meta, Google Ads, LinkedIn and Microsoft as conversions with the deal amount and currency attached, server to server, matched on the click ID and deduplicated on the Meta side, so the platforms optimise on qualified pipeline instead of form fills. And the Chrome extension draws the CRM's count as columns inside Meta Ads Manager and Google Ads, beside each platform's own conversions, so the gap is on the screen where budgets move.
What it will not do is make Meta agree with Google Ads. Both keep their own models, windows and view-through rules. What changes is that each total traces back to the same named records, so a gap is explainable in an afternoon instead of debated for a quarter. Native CRM integrations cover HubSpot, Salesforce, Pipedrive, Close, Attio, GoHighLevel, ActiveCampaign and Odoo, anything else connects by webhook, and setup takes about 21 minutes.
Read verified reviews on Trustpilot, G2 and leadjourney.io/testimonials.
Further Reading
Related reading: the true cost per lead for the efficiency number, multi-touch attribution for B2B lead generation for the models, server-side versus browser tracking for reason five, pixel and CRM mismatch and GA4 revenue attribution for the two commonest versions of this problem, and LeadJourney vs Google Analytics 4.
FAQ
Frequently Asked Questions
What marketers, founders and agencies ask when four dashboards disagree.
Why does Meta report more conversions than GA4?
Three reasons usually cover it. Meta counts view-through conversions from people who saw the ad without clicking, and GA4 cannot see those at all. Meta dates a conversion on the click or impression, while GA4 dates it on the day it happened. And GA4 loses browser events to ad blockers, iOS cookie limits and declined consent banners, which conversions sent server-side through Meta's Conversions API largely avoid.
Which number should I report to my board?
Closed revenue from the CRM by close date, with first and last touch shown side by side, plus the spend that produced it. Platform conversion counts are optimisation signals for the people running the accounts, not board numbers: they overlap across platforms, they include modelled and view-through conversions, and they are dated by click rather than by outcome.
Is it possible to make the numbers match exactly?
No, and a setup where they matched would mean something was being suppressed. The systems use different models, windows, timestamps and identity units by design. The achievable goal is a gap that is stable, explainable and classified, so every difference has a named reason and a rough size rather than being a mystery raised in each monthly meeting.
Why does my CRM show leads with no campaign at all?
Either the click ID was never captured at the first visit, or it was captured and lost before the form was submitted, usually by a redirect, a cross-domain hop or an embedded form. Some are genuinely sourceless, such as manual entries after an event. Count both groups for one week: the split tells you whether you have a tracking problem or a data entry habit.
Should I add Meta and Google conversions together?
No. Each platform counts a journey it touched in full, so a lead that saw a Meta ad and clicked a Google ad is counted once in each. Adding the two produces a number larger than the leads you actually received. Add spend across platforms, then divide by CRM leads for a blended figure, and keep the platform counts inside their own dashboards.
How long should a reconciliation take?
An afternoon for one campaign and one week, once you have exports carrying the click ID on both sides. Choose a week that finished at least 30 days ago so no attribution window is still filling, join on the click ID and then on hashed email, and classify every unmatched row into one of the seven reasons. Repeat it quarterly rather than monthly.
Keep reading
More from the blog
 B2B Marketing Attribution
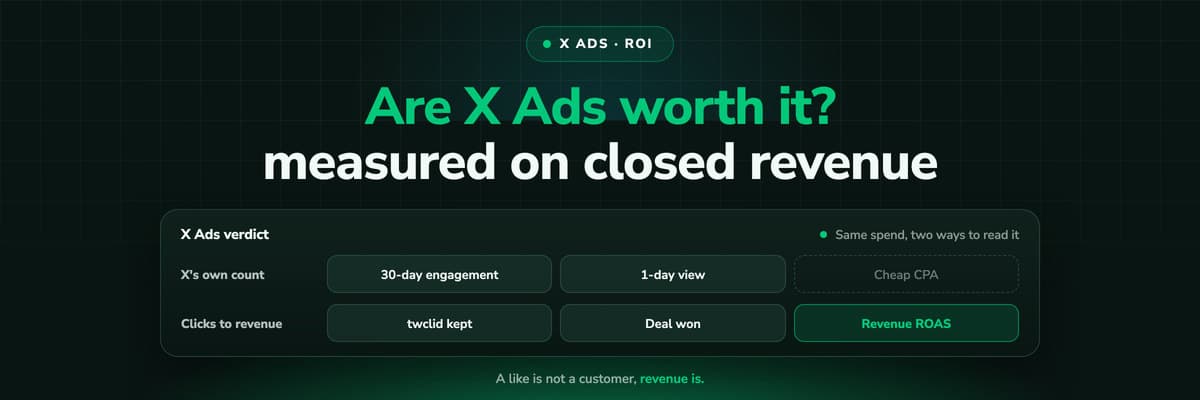
Are X Ads Worth It? Measuring X Ads ROI on Revenue
Whether X Ads are worth it depends on what you measure and on what you sell. How to calculate X Ads ROI and ROAS on closed revenue, what X's own conversion numbers include (a like a month before the purchase counts by default), what a fair test needs, and the traps that make X look better or worse than it is.Read the article16 min read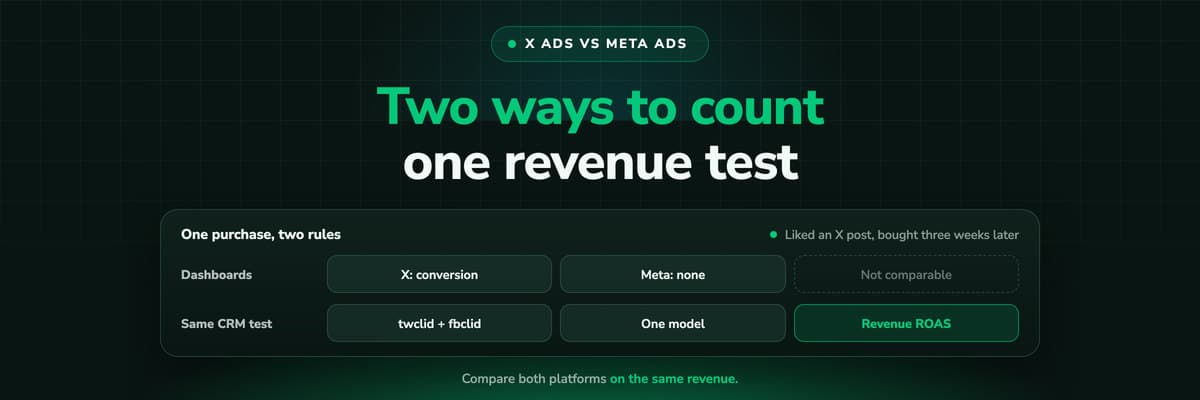 B2B Marketing Attribution
X Ads vs Meta Ads: How Each Counts a Conversion, Compared
X and Meta both report conversions, and the numbers are not the same kind of number. X credits a conversion up to 30 days after a like or a reply by default; Meta counts link clicks for 7 days. A sourced comparison of windows, server events, lead forms and CRM stages, and how to judge the two channels on the same closed revenue.Read the article15 min read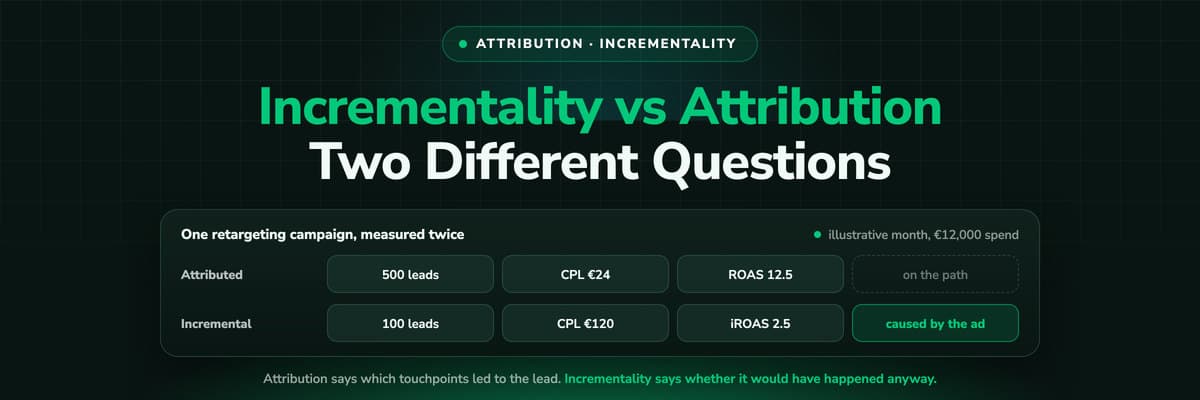 B2B Marketing Attribution
Incrementality vs Attribution: Which Question Each Answers
Attribution tells you which touchpoints led to a lead or a deal. Incrementality tells you whether it would have happened anyway. This guide works one retargeting campaign through both, shows where each belongs, and how to combine them when the outcome lives in your CRM.Read the article17 min read
One shared record
Ready to give every dashboard the same underlying record?
LeadJourney captures the click IDs server-side at the first visit, joins them to the person and follows your CRM stages to the closed deal, then sends those stages back to Meta, Google, LinkedIn and Microsoft with the deal value. Live in 21 minutes.