














BlogHow To Guides
BigQuery Marketing Attribution Without the GA4 Blind Spots
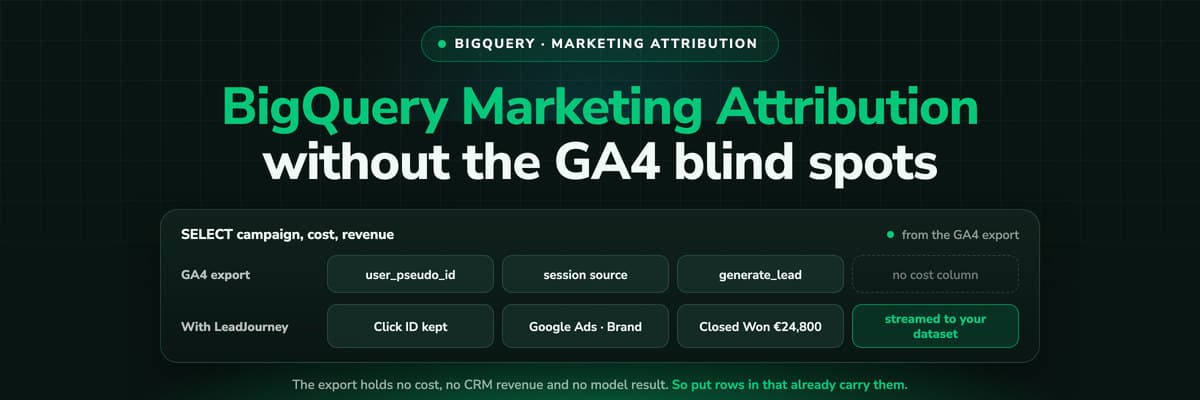
You can write a multi-touch attribution model in BigQuery in about eighty lines of SQL. Here they are, free. What no tutorial tells you is that the GA4 export you are querying carries no ad cost, no CRM revenue, no attribution model result and none of the consent-modelled conversions your GA4 dashboard shows, so the finished query answers a question nobody in the budget meeting asked.

Contents
Summarise this article with AI
Opens the page with a ready prompt in:


Nothing is sent until you pick a service.
The instruction is always the same. Turn on the GA4 BigQuery export, unnest the event parameters, group the events into sessions, order the sessions per user, split the credit across the path, and there is your multi-touch attribution model. It is a good weekend project, the SQL is genuinely not hard, and this article gives you the whole thing without a paywall.
The part the tutorials leave out is what happens on Monday. Somebody asks for cost per qualified lead by campaign, and the query has no cost column to divide by, because the GA4 export does not contain one. Somebody asks why the warehouse says 210 conversions and the GA4 dashboard says 260, and the answer is that the difference is modelled and modelled data is never exported. Somebody asks which campaign produced the deal that closed in November, and the export has never heard of your CRM.
So this is two articles. The first half is the working model, with runnable SQL against the documented GA4 schema. The second half is the four questions that model structurally cannot answer, and what has to land in the dataset instead if BigQuery is going to be where your marketing numbers actually live.
Quick Summary: What BigQuery Can and Cannot Attribute
In short
BigQuery is an excellent place to run an attribution model and a poor place to build one out of the GA4 export, because that export was never designed to carry the inputs a model needs. It has no ad cost or spend field, no attribution model result, no CRM revenue, and none of the consent-modelled conversions your GA4 reports show, and its identity column is a browser rather than a person. You can still write first-click, last-click and linear models over it in about eighty lines of SQL, and you should, because the exercise shows exactly where the holes are. The fix is not better SQL. It is putting rows into BigQuery that already carry the campaign, the click ID, the conversion it reached and the closed revenue, so the warehouse becomes the reporting layer rather than the modelling layer.
Below: the recipe every tutorial teaches, the SQL in full, the four things Google's own documentation says the export does not contain, a query that proves each one against your own dataset in seconds, and what a dataset built for attribution looks like instead.
The Recipe Every Tutorial Teaches
Search for BigQuery marketing attribution and you get ten results. Nine of them are the same five steps, written between 2021 and this year, and the tenth is a product page. The five steps are correct as far as they go.
- Link GA4 to BigQuery and wait a day for the first `events_*` table.
- Flatten `event_params`, which is a repeated key-value record, into columns you can read.
- Group events into sessions on `user_pseudo_id` plus the `ga_session_id` parameter.
- Pull the source, medium, campaign and any click ID off each session's first event to get one touchpoint per session.
- Order the touchpoints per user, cut them at the conversion, and divide the credit: all to the first, all to the last, or evenly across the path.
Nothing there is wrong. The problem is that step one decides everything after it, and every one of those articles takes step one for granted. The GA4 export is not a marketing dataset. It is a log of what the GA4 tag observed in a browser, which is a much narrower thing, and the difference only shows up once the model is finished and somebody tries to make a decision with it.
Why we are giving the SQL away
Because it is not the hard part, and pretending it is would be dishonest. Any competent analyst writes this model in a day. The hard part is that the model has no cost and no revenue in it, and no amount of SQL fixes a column that was never exported.
The Working Model, in Three Queries
Runnable against the documented GA4 export schema. Swap `my-project` and `analytics_123456789` for yours, and the two dates for your window. The three blocks are one statement: query 1 ends with a `SELECT` so you can inspect the touchpoints on their own, and you drop those last two lines when you chain all three. Nothing here needs a paid tool.
Query 1: one row per session, with the source that started it
`collected_traffic_source` is the record that holds what was actually on the URL: the UTM parameters and the click IDs. It is per event, so it is empty on most events in a session, which is why the second step takes the maximum rather than the first value.
WITH events AS (
  SELECT
    user_pseudo_id,
    (SELECT value.int_value FROM UNNEST(event_params)
       WHERE key = 'ga_session_id')                 AS session_id,
    event_timestamp,
    collected_traffic_source.manual_source          AS source,
    collected_traffic_source.manual_medium          AS medium,
    collected_traffic_source.manual_campaign_name   AS campaign,
    collected_traffic_source.gclid                  AS gclid
  FROM `my-project.analytics_123456789.events_*`
  WHERE _TABLE_SUFFIX BETWEEN '20260601' AND '20260831'
),

touchpoints AS (
  SELECT
    user_pseudo_id,
    session_id,
    MIN(event_timestamp) AS started_at,
    MAX(source)          AS source,
    MAX(medium)          AS medium,
    MAX(campaign)        AS campaign,
    MAX(gclid)           AS gclid
  FROM events
  WHERE session_id IS NOT NULL
  GROUP BY user_pseudo_id, session_id
)

SELECT * FROM touchpoints
ORDER BY user_pseudo_id, started_at;
Query 2: the path to a conversion, with a lookback window
`event_timestamp` is an integer of microseconds, not a timestamp, so a 90 day lookback is arithmetic rather than `TIMESTAMP_SUB`. That one detail is where most hand-written models quietly go wrong.
conversions AS (
  SELECT
    user_pseudo_id,
    MIN(event_timestamp) AS converted_at
  FROM `my-project.analytics_123456789.events_*`
  WHERE _TABLE_SUFFIX BETWEEN '20260601' AND '20260831'
    AND event_name = 'generate_lead'
  GROUP BY user_pseudo_id
),

paths AS (
  SELECT
    t.user_pseudo_id,
    t.source,
    t.medium,
    t.campaign,
    t.started_at,
    ROW_NUMBER() OVER (
      PARTITION BY t.user_pseudo_id ORDER BY t.started_at
    ) AS position,
    COUNT(*) OVER (PARTITION BY t.user_pseudo_id) AS touches
  FROM touchpoints t
  JOIN conversions c USING (user_pseudo_id)
  WHERE t.started_at <= c.converted_at
    -- 90 days, in microseconds
    AND t.started_at >= c.converted_at - 90 * 24 * 60 * 60 * 1000000
)
Query 3: three models over the same paths
First click, last click and linear are one `CASE` each. Time decay and position based are two more lines on the same shape. This is the whole of what a rules-based model is, which is worth knowing before anyone sells you one.
SELECT
  source,
  medium,
  campaign,
  ROUND(SUM(IF(position = 1, 1, 0)), 1)            AS first_click,
  ROUND(SUM(IF(position = touches, 1, 0)), 1)      AS last_click,
  ROUND(SUM(1 / touches), 1)                       AS linear
FROM paths
GROUP BY source, medium, campaign
ORDER BY linear DESC;
That is the model. It runs, it is auditable, it costs a few cents, and it will show you that your branded search campaign takes most of the last-click credit and almost none of the first-click credit, which is usually the first genuinely useful thing a company learns from doing this. See attribution model for what each rule is claiming.
Blind Spot 1: There Is No Cost Column
The output above counts credit. Nobody makes a budget decision on credit. The question is cost per lead by campaign, and the GA4 export has no field for what anything cost, because GA4 does not receive spend from anywhere except a linked Google Ads account, and even that stays in the reporting interface.
You do not have to take my word for it. Ask your own dataset:
SELECT column_name
FROM `my-project.analytics_123456789.INFORMATION_SCHEMA.COLUMNS`
WHERE table_name LIKE 'events_%'
  AND (LOWER(column_name) LIKE '%cost%'
    OR LOWER(column_name) LIKE '%spend%'
    OR LOWER(column_name) LIKE '%impression%');

-- 0 rows.
So every article promising marketing ROI in BigQuery needs a second pipeline nobody mentions in the introduction: an ETL tool pulling cost from Google Ads, Meta, LinkedIn and Microsoft on their own schedules, into their own schemas, with their own currency handling and their own definition of a campaign. That is a second project with a second budget, and it is the reason most of these models are abandoned about three weeks in. See the best marketing ETL tools if you are going down that road anyway.
There is a subtler version of the same problem. Once cost arrives from four platforms, it has to be joined to the touchpoints, and the only join key available is the campaign name as each platform spells it. A campaign renamed mid-quarter splits into two rows on one side of the join and stays one row on the other.
Blind Spot 2: The Export Has Never Heard of Your CRM
The model above attributes a `generate_lead` event, which is a form submission. For an e-commerce shop where the purchase happens on the site, that is close enough to revenue and the export's `ecommerce` record carries the amount. For anybody selling to businesses, it is not revenue at all. It is the start of a sales cycle, and between that form fill and the money there is a qualification call, a proposal, a stage the deal sat in for six weeks and a close date in another quarter.
None of that is in BigQuery, and none of it can be, because it happens in a CRM the GA4 tag cannot see. So the model divides credit across the path to a form fill, and a form fill is precisely the metric that made Meta send you 84 leads of which sales called 22 real. You have moved the wrong number into a warehouse and made it queryable.
- What the export can attributeA browser event: a page view, a form submission, an on-site purchase. Anything the tag fired.
- What the budget meeting asks aboutCost per qualified lead, cost per closed deal, and revenue by first and last touch.
- The gap between themEvery CRM stage after the form, which is where the difference between a good and a bad campaign actually shows.
Joining a CRM export to a GA4 export afterwards is the obvious idea, and it fails on the key. The CRM knows an email address. The export knows a `user_pseudo_id`. Nothing in either table connects them unless you were already writing an identifier into both at the moment of the form fill, which is not something you can start doing retroactively for last quarter. See why GA4, Meta and Google never agree with your CRM for the full version of that argument.
Blind Spot 3: GA4's Own Model Is Not in the Export
This one surprises people who assume BigQuery is simply GA4 with more detail. The data-driven attribution model that GA4 shows in its advertising reports, the one built on Google's own path analysis, does not appear in the export. There is no column carrying its output, no per-conversion credit split, nothing. Google's schema documentation lists no attribution model results at all.
What you get instead is `session_traffic_source_last_click`, which is last-click attributed session source, and `traffic_source`, which is the campaign that first acquired the user and, in Google's words, does not change if the user interacts with subsequent campaigns. Two fixed rules, both useful, neither of them a model.
So the GA4 interface and the GA4 export will never agree, and the exercise of reconciling them is wasted. If you want a data-driven model over your raw events you rebuild it yourself, which in practice means a Markov chain or Shapley values in Python over the paths from query 2. That is a real project with a real maintenance cost, and it is worth doing only once the paths it runs on contain cost and revenue, which brings us back to the first two blind spots.
Two more schema details worth knowing before you trust a number
`traffic_source` is not populated in the intraday tables, so a same-day query silently returns nothing for it. And on the streaming export, Google documents that `traffic_source.name`, `traffic_source.source` and `traffic_source.medium` are not populated for new users, which is exactly the population an acquisition report is about.
Blind Spot 4: The Modelled Conversions Are Never Exported
Your GA4 dashboard shows more conversions than your warehouse, permanently, and the difference is not a bug in your SQL. Under Consent Mode, visitors who decline the banner send no analytics event, and GA4 estimates what those visitors would have done. That estimate is what fills the gap in the interface.
It is not exported. Google's own description of both the daily and the fresh daily export is "Last click observed, no modeling". The rows for a visitor who declined consent do not exist in BigQuery, so a warehouse figure is always the observed subset and the dashboard figure is the observed subset plus an estimate. Both are labelled conversions.
You can measure the size of your own gap directly, because the export does carry the consent state per event:
SELECT
  privacy_info.analytics_storage,
  privacy_info.ads_storage,
  COUNT(*) AS events
FROM `my-project.analytics_123456789.events_*`
WHERE _TABLE_SUFFIX BETWEEN '20260601' AND '20260831'
GROUP BY 1, 2
ORDER BY events DESC;
In the European Union the denied share is routinely a third of traffic and on some accounts more than half. Run it before you present a warehouse number to anybody. See consent mode and GDPR compliant conversion tracking for the ways to lose less of it in the first place.
The Fifth Problem: user_pseudo_id Is a Browser
Every query above partitions on `user_pseudo_id`, and Google defines it as a pseudonymous ID assigned when a user first visits the site. It is per browser, on a device, and it is stored in a cookie. A person researching on a phone at lunch and converting on a work laptop is two of them. A person who cleared cookies is two of them. On Safari, a person who came back after the cookie's lifetime expired is two of them.
That does not just lose data, it biases the model in a specific and predictable direction. Splitting one path into two makes each fragment shorter, and the shorter a path is, the more the first touch and the last touch are the same session. Fragmented data makes single-touch models look reasonable and multi-touch models look pointless, which is the opposite of what is really going on.
If you send a `user_id` for logged-in users, you can measure the fragmentation on the population where you know the truth:
SELECT
  user_id,
  COUNT(DISTINCT user_pseudo_id) AS browsers
FROM `my-project.analytics_123456789.events_*`
WHERE _TABLE_SUFFIX BETWEEN '20260601' AND '20260831'
  AND user_id IS NOT NULL
GROUP BY user_id
HAVING browsers > 1
ORDER BY browsers DESC;
Whatever ratio that returns is a floor, not an estimate, because it can only see people who logged in. Everyone anonymous is fragmenting at least as badly and invisibly. See cross-device tracking.
The Cap Nobody Reads Until the Export Stops
A standard, free GA4 property exports up to one million events per day. That sounds enormous until you remember that an event is a page view, a scroll, an outbound click and a form interaction, so a moderately busy site clears it without being a large site at all.
What happens next is the part worth knowing in advance. Google notifies property editors by email, and a property that consistently exceeds the limit has its daily export paused. Previous days are not reprocessed. So the failure mode is not a warning banner on a chart, it is a hole in the middle of a table that nobody notices until a quarterly query returns a suspiciously flat week, and there is no backfill to repair it.
GA4 BigQuery export, the three modes
| Mode | Freshness | Event limit | The catch |
|---|---|---|---|
| Daily (batch) | Mid-afternoon, can slip to the next day | 1M/day on a standard property | Paused if the cap is consistently exceeded, with no reprocessing of earlier days |
| Fresh daily | Typically by 5am | 1M/day on a standard property | Same cap, same pause |
| Streaming | Within minutes | No event limit | Best-effort, documented without a completeness SLO and may contain data gaps; no traffic_source for new users |
The usual answer is to filter events out of the export before they count against the cap, which works and means deciding today which events you will never want to query. The other answer is Analytics 360, which raises the cap to 20 billion and costs what an enterprise contract costs.
The Fix Is Not Better SQL, It Is Better Rows
Step back from the five blind spots and they have one shape. Each is something that happened outside the browser: money was spent in an ad account, a salesperson moved a deal to closed won, a visitor declined a banner, the same human picked up a different device. The GA4 export is a faithful record of a browser, and every question that matters is about something the browser never saw.
Which means the modelling has to happen where those facts exist, and the warehouse gets the result. That inverts the usual architecture, and it is the right way round. BigQuery is superb at storing an attributed dataset, serving it to Looker Studio, Power BI and Tableau, joining it to finance data and holding years of it cheaply. It is a bad place to reconstruct a customer journey from browser logs, because the inputs are not there and no query language adds a column that was never exported.
Two ways to fill a marketing dataset
| The question | GA4 export plus SQL | Attributed rows streamed in |
|---|---|---|
| Which campaign produced this lead? | Last-click session source, if the cookie survived | The stored click ID from the first visit, on the lead record |
| What did that campaign cost? | Not in the export. Build a second pipeline | The campaign is on every row, so cost joins on an ID rather than a name |
| What was the deal worth? | Not in the export. The CRM is invisible to it | The conversion it reached and the amount travel with the row |
| Can I switch attribution models? | Rewrite the CASE and re-run over raw events | First click, last click, linear, time decay and position based over the same records |
| What about visitors who declined consent? | Absent, and the dashboard's modelled estimate is not exported | First-party and server-side, so far less is lost before consent is even the question |
| Is one person one row? | One browser is one row | The anonymous first click is joined to the person at the form fill |
Nothing in the right-hand column is exotic. It is what an attribution product is for, and the only real decision is whether the finished data stays in that product's interface or lands in a dataset you own. It should land in a dataset you own, which is the whole argument for a marketing data warehouse in the first place.
How LeadJourney Fills a BigQuery Dataset
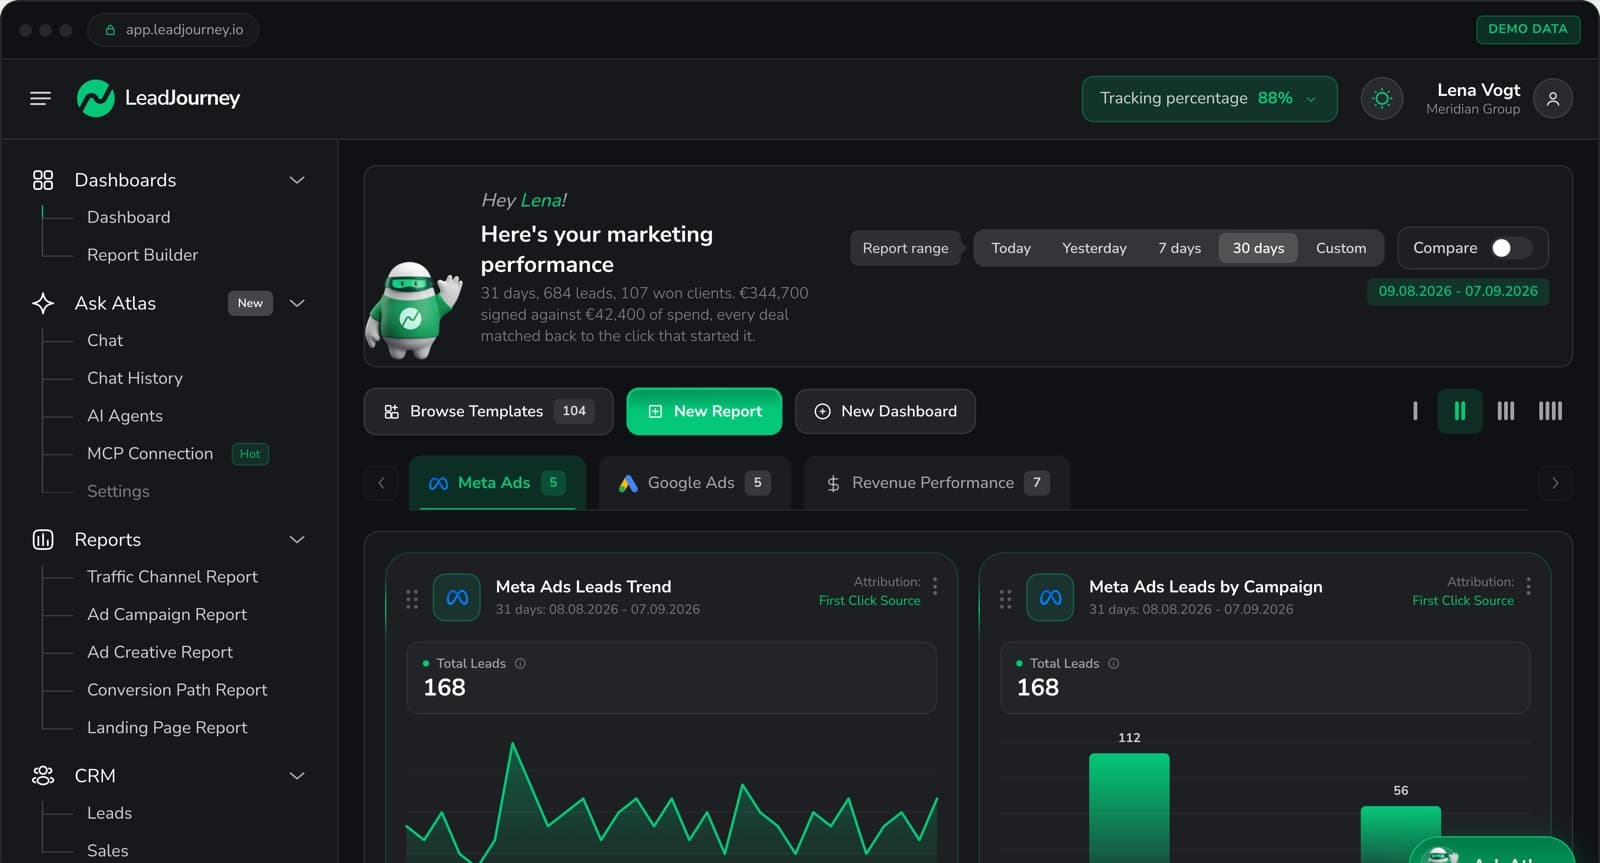
Tracking runs server-side on your own domain at 95%+ accuracy, so the click IDs are captured at the first visit and kept: gclid with gbraid and wbraid, fbclid, li_fat_id and msclkid, plus the UTM parameters and the landing page. That anonymous first click is joined to a person at the form fill, the call or the booking, and from there the record follows your CRM stages to the closed deal. Native integrations cover HubSpot, Salesforce, Pipedrive, Close, Attio, GoHighLevel, ActiveCampaign and Odoo, and anything else connects by webhook.
The BigQuery export is then switched on from the Apps tab. You create the dataset in your own Google Cloud project, grant a service account BigQuery Data Editor on that one dataset, and paste the key. LeadJourney creates the tables for you, partitioned by day, so a year of clicks still queries cheaply, and adds columns as your mapping grows.
From then on, clicks, conversions and leads are written into your dataset within a couple of minutes of happening: each row already carrying the campaign, ad set, ad and keyword that produced it, the revenue attached to it, and the last conversion it recorded, whether that is Booked, Closed Won or whatever your conversion types are named.
The dataset is in your own Google Cloud project. There is no pipeline of ours to maintain and no scheduled job to babysit. And because Looker Studio, Power BI and Tableau all read BigQuery through their own first-party connectors, there is no connector of ours standing between you and your dashboards either. That is a fact about BigQuery rather than a feature of ours, and it is worth saying plainly. The export is one-way: nothing is ever read back out, and the only thing LeadJourney can reach in your project is the dataset you granted it.
What you write in the warehouse changes shape as a result. The eighty lines above become a `GROUP BY` over rows that already know their campaign and their revenue, and the interesting queries stop being about reconstructing journeys and start being about the business: cohorts by close month, payback by channel, pipeline by first touch against last touch, marketing joined to the finance tables that were already in there.
Two honest limits. The export is on the Scale and Enterprise plans, not the entry tier, so it is priced for teams that own a warehouse. And Snowflake is on the roadmap rather than shipped: today the warehouse destination is BigQuery, and saying otherwise to a data team would be found out in the first call. Setup takes about 21 minutes, and you can click through the whole product before talking to anybody.
What Actually Lands in the Table
You choose the columns. The mapping screen lists every LeadJourney field and you point each one at a column name, so the table arrives in your dataset's own conventions rather than ours. What is worth mapping first:
- The attribution. Traffic channel, plus first-touch and last-touch campaign, ad set, ad, asset and keyword, each as both an ID and a readable name.
- The click identifier (ref_id). Whichever platform ID came in on the click, whether gclid, fbclid, li_fat_id or msclkid, so a row joins straight back to your ad platform's own export.
- The money. Revenue and cash collected, created as NUMERIC rather than float, so summing a revenue column and comparing it to your invoices gives you the same number.
- The person and the context. Email, phone, name, and the geo, device and referrer of the first and the last click.
Columns are created nullable on purpose. A click arrives before an email address does, and a row that shows up thin at 10:04 and gets enriched later is the shape attribution actually has.
Two Ways to Write a Table
Every destination is one of two modes, and the choice decides what your dashboards can do.
- Append a rowOne row per event, the full history, ready to aggregate. This is what you want for clicks and conversions.
- Create or update a rowOne row per lead, matched on a column you nominate and replaced when that lead comes back. This is what you want when a table should read as the current state of every lead rather than a log.
Retries cannot double-count: a row carries the source record's ID as its de-duplication key, so a network timeout and a retry collapse into the row that already landed. Rows BigQuery rejects appear in the delivery history with Google's reason attached, rather than disappearing.
Switching the Export On
Six steps, and five of them happen in Google Cloud rather than in LeadJourney, which is the point: the dataset is yours before anything is written to it.
- Create the dataset, in BigQuery, in your own project. Pick your region and note it. LeadJourney deliberately cannot create datasets: the container for your data is yours to make.
- Create a service account and download a JSON key. IAM & Admin, then Service Accounts, then Keys, Add key, JSON.
- Grant it BigQuery Data Editor on that dataset. On the dataset, not the project. That is the whole blast radius of the key you are about to hand over.
- Paste the key into Apps, then BigQuery. It is checked against the dataset before anything is stored, so a wrong key or a missing grant fails there and then, with a message that says which.
- Add a destination. Choose the event, whether New Click, New Conversion Event or New Lead, name the table or take the default, choose append or update, and map your columns. A conversion destination can be narrowed to a single conversion type, so Closed Won can have a table of its own.
- Point Looker Studio, Power BI or Tableau at the dataset. Nothing to install on our side.
One thing to size before you switch clicks on
Conversions and leads are low volume and cheap. Clicks are not: one row per click can be tens of thousands a day, and Google bills streaming inserts by data size. Map only the columns you will actually query on that one.
Before You Write a Line of SQL
Whichever route you take, these six checks take an afternoon and decide whether the project is worth starting.
- Run the consent query. If a third of your events carry denied storage, a warehouse model is measuring two thirds of your marketing and no SQL recovers the rest.
- Run the fragmentation query. The browsers-per-user ratio is the floor on how badly paths are being split, and it decides whether multi-touch is even meaningful on your data.
- Count your daily events against the cap. One million a day on a standard property, and the export pauses without a backfill.
- Name the cost pipeline. Which tool pulls spend from which platforms, on what schedule, at what price, and who fixes it when a campaign gets renamed.
- Name the revenue join key. Not the plan to invent one later. The field that exists today in both the CRM and the web data, written at the moment of the form fill.
- Decide what the warehouse is for. If the answer is reporting and joining to finance, it is the right tool. If the answer is reconstructing journeys from browser logs, the inputs are missing and the project will stall at the same place everyone else's does.
Verdict
BigQuery is the right home for marketing attribution and the wrong place to manufacture it. Get the rows right upstream and the SQL becomes trivial; get the rows wrong and no query fixes them.
Further Reading
Related reading: the BigQuery integration for what actually lands in the dataset, the best marketing data warehouse for choosing one, multi-touch attribution for B2B lead generation for the models themselves, server-side versus browser tracking for why the collection layer decides the ceiling, gclid explained and UTM parameters explained for the join keys, GA4 revenue attribution for the commonest version of this problem, and LeadJourney vs Google Analytics 4 for the side by side.
FAQ
Frequently Asked Questions
What analysts and marketing leads ask before building an attribution model in BigQuery.
Can I build a multi-touch attribution model in BigQuery?
Yes, and the SQL is straightforward: group events into sessions, take the source off each session, order the sessions per user, cut the path at the conversion and split the credit. This article gives you the full query. The limitation is not the model, it is the data underneath it. The GA4 export carries no ad cost, no CRM revenue and no attribution model result, so the finished model tells you which channels appear in a path but not what any of them cost or earned.
Does the GA4 BigQuery export include Google Ads cost data?
No. The export schema has no cost, spend or impression fields at all, and you can confirm it against your own dataset with a query on INFORMATION_SCHEMA.COLUMNS. Cost has to arrive through a separate pipeline from each ad platform, which then has to be joined to your touchpoints on campaign names, and that join breaks whenever somebody renames a campaign.
Why does my BigQuery data show fewer conversions than GA4?
Because the difference is modelled. Under Consent Mode, visitors who decline the banner send no event, and GA4 estimates what they would have done to fill the gap in its reports. Google describes both the daily and fresh daily exports as last click observed with no modeling, so none of that estimate reaches BigQuery. Your warehouse figure is the observed subset; the dashboard figure is the observed subset plus an estimate.
Is GA4's data-driven attribution available in BigQuery?
No. The model runs in GA4's reporting interface and its output is not part of the export schema. What the export gives you is session_traffic_source_last_click, which is a last-click rule, and traffic_source, which is the campaign that first acquired the user and does not change afterwards. If you want a data-driven model over raw events you rebuild it yourself with a Markov chain or Shapley values, which is a real project rather than a query.
What happens if I exceed the 1 million event BigQuery export limit?
Google emails the property editors, and a standard property that consistently exceeds the daily cap has its export paused. Earlier days are not reprocessed, so you get a permanent hole rather than a delayed load. The workarounds are filtering events out of the export before they count, which means deciding now which events you will never want to query, or moving to Analytics 360.
Should I use BigQuery or an attribution tool?
Both, in that order. The attribution happens where the facts live, which means server-side collection that keeps the click ID and a CRM connection that knows what the deal was worth, and the finished rows land in BigQuery so you own them, can join them to finance data and can read them from Looker Studio, Power BI or Tableau. Using the warehouse as the modelling layer over browser logs is the version that stalls, because the inputs a model needs were never in the export.
Can LeadJourney export raw data to BigQuery?
Yes. You create the dataset in your own Google Cloud project, grant a service account BigQuery Data Editor on that one dataset and paste the key in the Apps tab. LeadJourney creates the tables, partitioned by day, and from then on clicks, conversions and leads are written in with the campaign, ad set, ad and keyword that produced them, the revenue, and the last conversion each one recorded. The export is one-way: nothing is read back out, and the only thing it can reach in your project is the dataset you granted it. Available on the Scale and Enterprise plans. Snowflake is on the roadmap rather than shipped.
Does the export load my historical data?
No. A table starts filling from the moment you switch the destination on. If you need the history in there, that is a one-off load to talk to us about rather than a setting.
How fast do rows arrive in BigQuery?
Rows land about two minutes behind the event. The short hold is deliberate: a lead that gets an email address attached thirty seconds after the click should be written once, complete, rather than written thin and left that way, because an appended BigQuery row is history and stays exactly as thin as it was written.
What will the export cost me in BigQuery?
Conversions and leads are low volume and cheap. Clicks are not: one row per click can be tens of thousands a day, and Google bills streaming inserts by data size, so map only the columns you will actually query on that table. Storage and query costs are billed to your own project the way the rest of your dataset already is.
Keep reading
More from the blog
 How To Guides
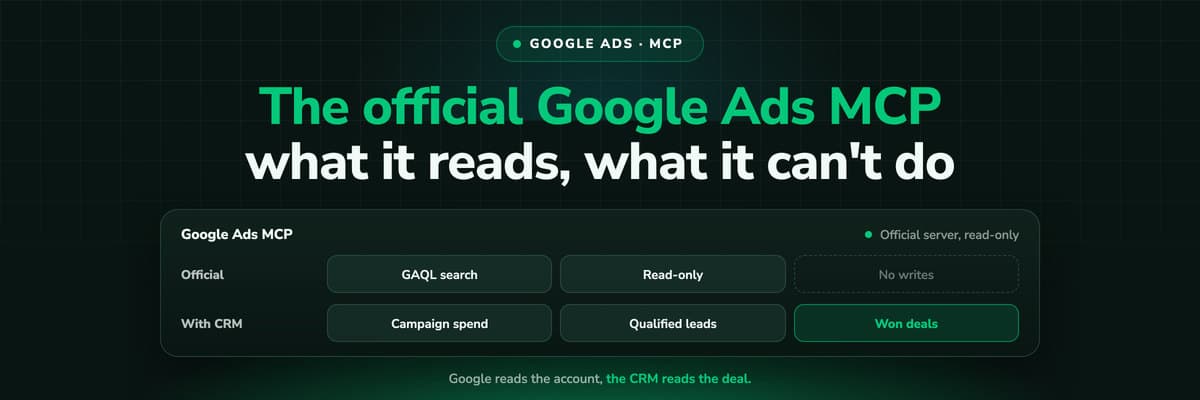
Google Ads MCP: The Official Server, Its Limits, Options
Google publishes an open source MCP server for the Google Ads API. It is read-only, has three tools and no public URL. What it does, how to run it locally or on Cloud Run, how Claude and Claude Code connect to it, what it cannot do, and the third-party servers that fill the gaps.Read the article13 min read How To Guides
Meta Ads MCP: Setting Up Meta's Official Server
Meta runs its own MCP server for ads at mcp.facebook.com/ads. What it does, which permissions it needs, how agencies get access, how to add it to Claude and ChatGPT, what the third-party servers offer instead, and how to use the write tools without spending money by accident.Read the article12 min read How To Guides
LinkedIn Ads MCP: Your Options Without an Official Server
LinkedIn has no official MCP server as of October 2026, unlike Meta, Google, Microsoft, TikTok and X. What the third-party LinkedIn Ads MCP options are, why there are so few, what to check before you connect one to an account with spend on it, and how to ask Claude about LinkedIn campaigns on pipeline rather than form fills.Read the article11 min read
Your dataset, already attributed
Ready to query rows that know what they cost and what they earned?
LeadJourney captures the click IDs server-side at the first visit, joins them to the person and follows your CRM stages to the closed deal, then streams those records into your own BigQuery dataset. Live in 21 minutes.
30-day money-back guaranteeSetup with a tracking expert