














BlogHow To Guides
Incrementality Testing for Lead Gen: Run a Test on CRM Revenue
A lift test is only as good as the outcome it reads, and for lead generation the platforms read form fills. This guide compares the methods, lists what Google and Meta require for a lift study, and walks through a geo holdout read on qualified leads and deals from your CRM, with a worked example that adds up.


Contents
Summarise this article with AI
Opens the page with a ready prompt in:


Nothing is sent until you pick a service.
Your Meta account reports 192 leads at €125 each. Your CRM, joined to the clicks, credits Meta with 96 qualified leads. Both numbers answer the same question: which leads came through this channel. Neither answers the one your budget depends on: how many of those leads would have arrived anyway if the ads had been off.
That second question is incrementality, and the only way to answer it is an experiment: switch the ads off for a group of people or a group of regions, keep everything else the same, and compare. Google and Meta will run one for you if your account qualifies. You can also run one yourself with nothing but the ad platform's location targeting and a CRM export.
This guide is written for lead generation, where the hard part is not the test design but the outcome. A platform lift study reads the conversions the platform sees, which for a lead gen account are usually form fills. Your business runs on qualified leads, deals and revenue, which live in the CRM and close weeks later. The method below reads those. The definitions are in the glossary entry on incrementality; when to test and when attribution is enough is incrementality vs attribution.
Quick Summary: Incrementality Testing in One Paragraph
In short
An incrementality test withholds ads from a randomly or carefully chosen group of people or regions and compares their outcomes with the group that saw the ads; the difference is what the ads caused. For lead generation the test is only as good as its outcome metric, so read it on qualified leads and deals from the CRM, not on platform form fills. Google's Conversion Lift based on users needs at least 1,000 observed conversions and a $5,000 USD campaign budget; its geography version accepts offline data at ZIP or city level; Meta's Conversion Lift runs in the Experiments tool and shows spend minimums when you create the test. Without either, a DIY geo holdout works: pick matched regions, record a pre-period, switch one channel off in the holdout for four to eight weeks, and compare the test regions with what the holdout predicts. Expect a lift test to credit a channel with fewer conversions than its attribution does, often a lot fewer for retargeting and brand search, and use the ratio to correct your attributed figures.
If you only need the arithmetic, the incrementality calculator takes test and control counts and returns the lift, iROAS and a significance read. If you are deciding whether to test at all, start with incrementality vs attribution.
What an Incrementality Test Measures
Attribution assigns the conversions that happened to the touchpoints before them. An incrementality test estimates the conversions that would not have happened without the ads, by comparing a group that could see them with a group that could not.
Test regions bring 360 qualified leads, the holdout predicts 300 without ads: lift = (360 - 300) / 300 = 20%, and 60 leads were incremental.
Three numbers come out of every test. The lift is the relative increase. The incremental conversions are the absolute count the ads added. Divided into the spend, they give the incremental cost per conversion; divided into incremental revenue, the spend gives iROAS. The glossary entry on incrementality defines each one, and return on ad spend covers the attributed version iROAS is compared with.
Incrementality test vs A/B test
An A/B test compares two versions of an ad, a page or an audience; both groups see something. An incrementality test compares ads with no ads. The first tells you which version works better, the second whether the channel works at all.
Incrementality Testing Methods Compared
Five designs cover almost every test a marketing team runs. They differ in who does the split, what outcome they can read and how much volume they need.
Incrementality testing methods, and what each one can read
| Method | How the split works | Outcome it reads | Best for |
|---|---|---|---|
| Platform conversion lift, user-based | The platform randomly withholds ads from a share of the target audience | The platform's own conversions (Google lists enhanced conversions for leads) | Large accounts on one platform that want a clean randomised answer |
| Platform geo lift | The platform splits regions into ads on and ads off | Online conversions plus offline data by region (Google: ZIP or city level) | Channels whose effect lands offline or in the CRM |
| DIY geo holdout or matched markets | You pick comparable regions and exclude one set in location targeting | Anything you can count by region: CRM qualified leads, deals, revenue | Lead gen accounts below platform minimums, or any test on CRM outcomes |
| On/off or pause test | The channel runs, pauses, runs again, and you compare periods | Anything you can count by week | A rough first read when nothing else is possible |
| Open source geo tools | Meta's GeoLift (R) or Google's matched_markets (Python) pick markets and read the result | Whatever KPI you feed in, by date and location | A DIY geo test with a proper synthetic control instead of a simple ratio |
The user-based platform study is the most rigorous, because the platform randomises individuals and nobody else can. Its weakness for lead gen is the outcome: it reads what the platform's pixel or conversion API reports. A geo design is noisier, as Google says of its own, but it can read any outcome you can count by region, and that is the one lead gen needs. A pause test has no control group at all, so seasonality and everything else that changed that month land in the result; use it to decide whether a proper test is worth running.
Google Ads Conversion Lift: What It Requires
Google offers Conversion Lift based on users and based on geography. Both are set up inside Google Ads, and Google says plainly that the feature is not available to every account: you ask your Google account representative. Requirements as read on Google Ads Help on 7 October 2026.
Google Ads Conversion Lift requirements, as published on Google Ads Help
| Requirement | Based on users | Based on geography |
|---|---|---|
| Access | Through your Google account representative | Through your Google account representative |
| Volume | At least 1,000 observed conversions | No fixed minimum; a feasibility status of High, Medium or Low |
| Budget | Minimum campaign budget of $5,000 USD | Tends to be higher than a user-based study |
| Campaign types | Display, Search, Video, Demand Gen, App, Performance Max (not iOS app campaigns or Travel Ads) | App, Demand Gen, Discovery, Display, Video, Search, Shopping, Performance Max |
| Outcome | Compatible conversion actions, including enhanced conversions for leads | Google Ads tag, Firebase, DV360 Floodlight, or offline data at ZIP or city level |
| Duration | At least 7 days, more than 14 recommended | Start and end dates you choose |
| Other limits | A campaign can be in one study at a time | Campaigns must target a single country |
Two details matter for lead gen. Google warns of up to a 17% drop in measured absolute lift in studies with a long conversion lag that run for less than 14 days, and a B2B lead has a long lag almost by definition. And the geography version is the one Google describes as measuring online and offline conversions: if the outcome you care about is a deal in the CRM, that is the study type to ask about, with your offline conversion data by ZIP or city.
Meta Conversion Lift: What It Requires
Meta runs Conversion Lift tests in its Experiments tool, where the test creates a test group that can see your ads and a holdout that cannot. Meta suggests starting with an account-level test that measures all of your Meta advertising at once.
- Spend minimums are shown in the toolMeta says some conversion lift tests display spend minimums or recommended spend when you create them, and that your account representative knows which minimums apply. It publishes no single threshold on the pages we read, so we print none.
- The Conversions API is required for web eventsConversion lift tests measuring standard web events since 1 October 2021 require the Conversions API, according to Meta's page on Facebook-managed tests. A pixel alone is not enough.
- 80% power before, 90% confidence afterMeta suggests an estimated power of 80% or more before a test starts, and treats a lift result at 90% confidence or higher as statistically reliable.
- Check the outcome eventWhether your test can read an offline or CRM event, such as a qualified lead sent back through the Conversions API, depends on the study type. Meta's help pages we read do not say, so check in Experiments before you plan around it.
Meta also offers an incremental attribution setting, which changes what Ads Manager optimises for rather than running a test; Meta incremental attribution covers it. For a geo test you design yourself, Meta's open source GeoLift package picks the markets and reads the result with a synthetic control.
Why a Lead Gen Test Has to Read the CRM
A lift study answers exactly the question it is given. Give it form fills and it tells you how many form fills the ads caused, which is not the same as how many customers.
- Form fills and qualified leads move apart. A campaign optimised for cheap leads can raise form fills in the test group while adding few qualified leads, because the extra fills are the ones sales rejects. A lift on form fills then overstates the channel.
- The platform never sees the deal. A deal is closed in HubSpot, Salesforce or Pipedrive weeks after the click. Unless the qualified lead and the won deal are sent back to the platform, its lift study cannot read them.
- Retargeting and brand search look best on the wrong outcome. Both reach people who were already on their way, so both collect form fills that would have arrived anyway. Measured on deals, the gap between attribution and lift is usually widest exactly there.
There are two ways to put the CRM outcome into a test. Send qualified leads and won deals back to the platform as conversions, through Meta's Conversions API and Google's offline conversion import, and ask whether your study type can read them. Or run the test yourself and count the outcome in the CRM by region, which works whatever the platform accepts. The rest of this guide does the second.
How to Run a Geo Holdout Test for Lead Gen, Step by Step
A geo holdout switches one channel off in a set of regions and keeps it on in comparable ones. Everything below can be done with location targeting in the ad platform and a CRM export.
- Pick the outcome before anything else. Qualified leads as the primary read, because they arrive within the test; deals and revenue as the secondary read, later. Write down the CRM stage that counts as qualified and do not change it during the test.
- Make sure the CRM knows the region. Every lead needs a region field you trust: the state, the ZIP code or the city from the form, the billing address or the company's location. The IP's location is a fallback, not a source. If a third of your leads have no region, fix that first.
- Pick the regions. Use the smallest unit the ad platform can target and the CRM can record: US states or DMAs, German Bundesländer, UK regions. Split them into a test set and a holdout set with similar volume, similar seasonality and no shared big city. Twenty or more units is what GeoLift's own best practices recommend; fewer works, with a noisier result.
- Record a pre-period. Count qualified leads and deals per region for several weeks with the channel on everywhere. GeoLift recommends four to five times the test duration of stable history. The ratio between the two sets in this period is what predicts the holdout's counterfactual later.
- Size the test. Estimate how many qualified leads the holdout will see in the test period and check them against the rule of thumb in the next section. If the numbers are too small, test a bigger channel, use more regions or run longer.
- Run it. Exclude the holdout regions from the channel under test, and only that channel, for four to eight weeks. Keep budgets, bids and creative in the test regions as they were, and keep every other channel unchanged in both sets.
- Read qualified leads at the end of the test. Expected test result = holdout result times the pre-period ratio. Incremental leads = test result minus expected. Lift = incremental divided by expected.
- Read deals and revenue once the leads have had time to close. Usually one sales cycle after the test ends. Count the deals that came from leads created during the test, by region, with the same ratio.
The pre-period ratio is the simplest honest way to build the counterfactual. Meta's GeoLift and Google's matched_markets replace it with a synthetic control or a time-based regression, which handles regions that drift apart; for a first test, the ratio is easier to explain to a finance team and a fair start.
How Big and How Long a Test Has to Be
Most failed incrementality tests are not wrong, they are too small: the noise between regions is larger than the effect. A rough rule of thumb tells you before you start whether that will happen.
- About 16 divided by the lift squared, per sideFor counts like leads, a test has a reasonable chance of detecting a lift L when each side expects roughly 16 / L² conversions. A 20% lift needs about 400 per side, a 10% lift about 1,600. Regions add noise of their own, so treat this as the floor.
- Four to eight weeks, and at least one buying cycleGoogle recommends more than 14 days for its own studies, GeoLift at least 15 days on daily data and one full purchase cycle. For a lead gen account, four weeks is the realistic minimum for qualified leads.
- Deals take a sales cycle longerA test that ends in week six has its qualified leads in week six and its deals in month four. Plan the deal read before the test starts, so nobody stops waiting.
The arithmetic is unforgiving for B2B. An account with 100 qualified leads a month cannot detect a 10% lift in any reasonable time, and should either test a bigger effect (switching a whole channel off rather than a campaign) or accept a directional answer. The incrementality calculator runs the significance test on your own counts.
A Worked Example: A Geo Holdout on Meta Ads
An invented B2B services company runs Meta, Google Ads and LinkedIn across 24 regions. It splits them into 12 test regions and 12 holdout regions, records 8 weeks with Meta on everywhere, then switches Meta off in the holdout for 6 weeks. Every figure below computes.
Illustrative geo holdout: qualified leads and deals from the CRM, by region set
| Period and outcome | Test regions | Holdout regions | Ratio |
|---|---|---|---|
| Pre-period, 8 weeks, Meta on everywhere: qualified leads | 480 | 384 | 1.25 |
| Pre-period: deals from those leads | 80 | 64 | 1.25 |
| Test, 6 weeks, Meta off in the holdout: qualified leads | 360 | 240 | |
| Test: deals from those leads, read 90 days later | 58 | 40 |
Without Meta, the test regions would have produced what the holdout did, scaled by the pre-period ratio: 240 x 1.25 = 300 qualified leads. They produced 360, so Meta added 60, a lift of 60 / 300 = 20%. For deals, the expected figure is 40 x 1.25 = 50 against 58 actual: 8 incremental deals, a lift of 16%.
The same Meta spend, read three ways (test regions, 6 weeks, €24,000)
| Read | Conversions credited to Meta | Cost per conversion | Revenue and ROAS |
|---|---|---|---|
| Meta Ads Manager: leads | 192 form fills | €125 | |
| CRM attribution, first click | 96 qualified leads, 16 deals | €250 per qualified lead, €1,500 per deal | €144,000, ROAS 6.0 |
| Geo holdout | 60 qualified leads, 8 deals | €400 per qualified lead, €3,000 per deal | €72,000, iROAS 3.0 |
With an average deal of €9,000, the 8 incremental deals are €72,000 of incremental revenue on €24,000 of spend: an iROAS of 3.0, half the ROAS attribution showed. The holdout found 60 of the 96 attributed qualified leads (0.625) and 8 of the 16 attributed deals (0.5). Meta was worth running; it was not worth what either Ads Manager or the attribution report said.
Is the result real?
A rough check, treating the counts as random and the ratio as fixed: the qualified lead difference of 60 is about 2.2 times its standard error, which is a result to act on. The deal difference of 8 is about 0.7 times its standard error, which is not proven. That is the long sales cycle problem in one line: decide on qualified leads now, and treat the deal read as a check.
Incrementality Testing Pitfalls in Lead Gen
Each of these can turn a clean design into a wrong answer, and most are invisible in the result table. Check them before the test and again before you read it.
- Too small to say anythingA holdout with 40 qualified leads cannot tell a 20% lift from noise. Size it first, and say so when a result is directional.
- Contamination between regionsPeople commute, work remotely and see ads targeted at their office's region. Leave a border region out of both sets where you can, and expect location targeting to leak a little.
- Seasonality and one-off eventsA trade show, a press mention or a holiday in one set breaks the comparison. GeoLift's best practices say to keep local marketing constant across test and control markets.
- Sales capacityIf the sales team cannot follow up every lead, qualified leads and deals in the test regions are capped by people, not by ads. Check the response times in both sets.
- Brand search leakageSwitching off Meta in the holdout lowers brand searches there too, so Google brand campaigns quietly lose leads in the holdout. That is part of Meta's effect; do not credit it to Google, and do not change brand bids during the test.
- Moving the goalpostsChanging the definition of a qualified lead, the budget or the creative mid-test ends the test. Write the plan down and let it run.
What to Do With the Result
A single test is not a new dashboard. It is a correction factor for the dashboard you already have, valid until the channel, the creative or the budget changes a lot.
- Calibrate attribution with the ratio. In the example, multiply Meta's attributed qualified leads by 0.625 and its attributed deals by 0.5 when comparing it with other channels. Keep using attribution for daily decisions inside the channel; incrementality vs attribution covers how the two combine.
- Set budget on incremental cost. €400 per incremental qualified lead and €3,000 per incremental deal are the numbers to compare with your target cost per acquisition, not €125 or €250.
- Feed the platform the outcome you tested on. Sending qualified leads and won deals back with their value makes the platform optimise for what the test showed matters. Sending CRM data back to Meta and Google covers how.
- Retest when something big changes. A new market, a doubled budget or a new offer can move the lift. Twice a year for the largest channel is a reasonable rhythm.
- Test the suspicious channels next. Retargeting and brand search are where attribution and lift disagree most, which makes them the cheapest tests to learn from.
For the budget split across many channels at once, a sequence of tests becomes slow, and teams look at marketing mix modelling; MMM vs MTA covers when that is worth it for a lead gen budget, and why lift tests are what calibrates both.
How LeadJourney Fits Into an Incrementality Test
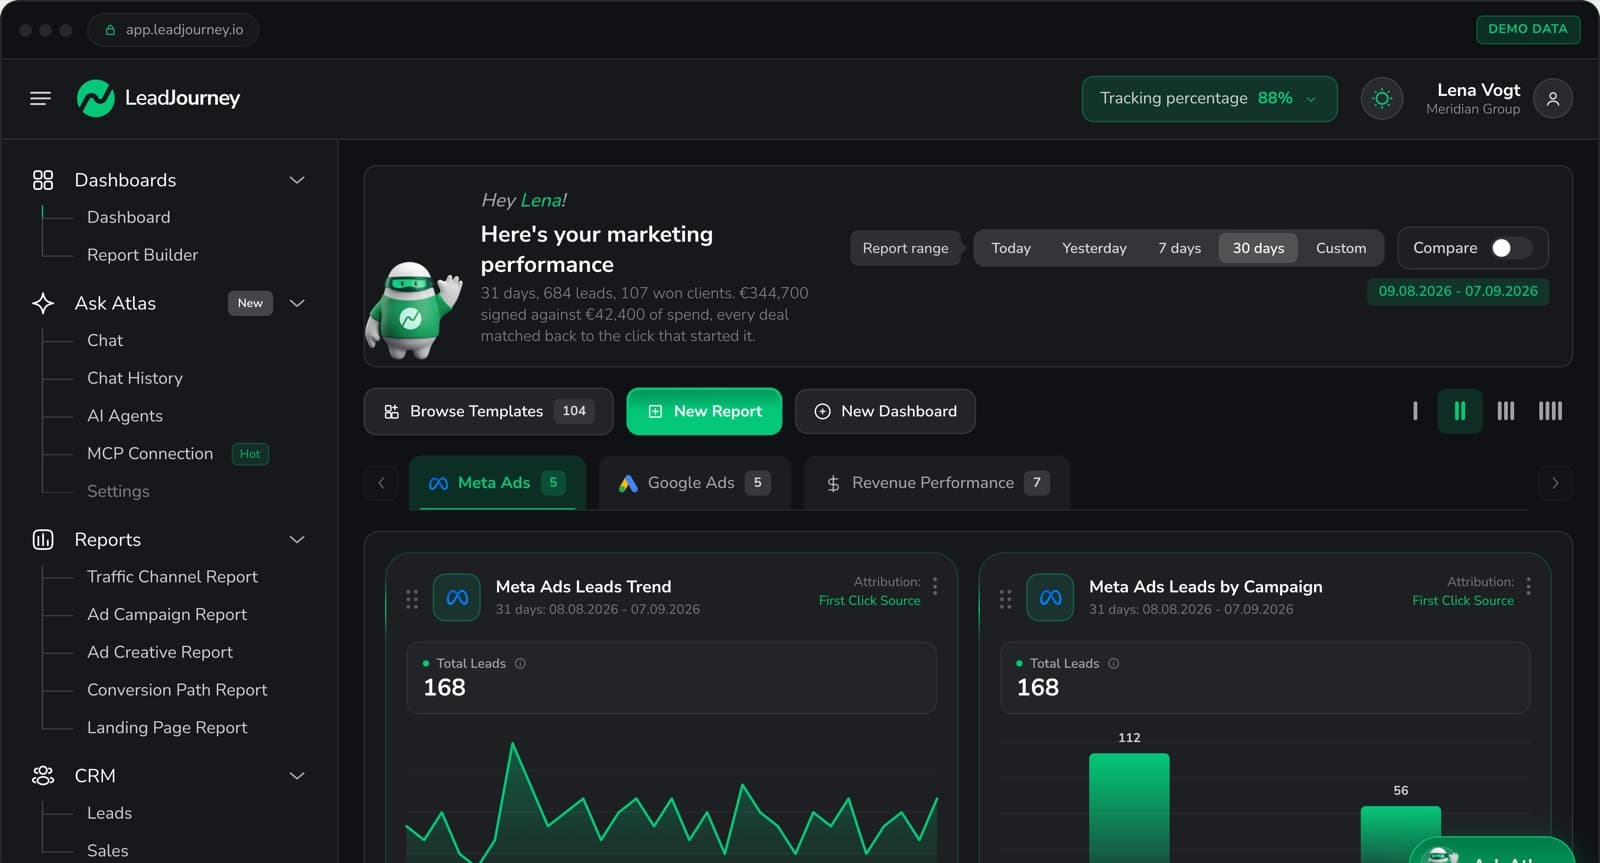
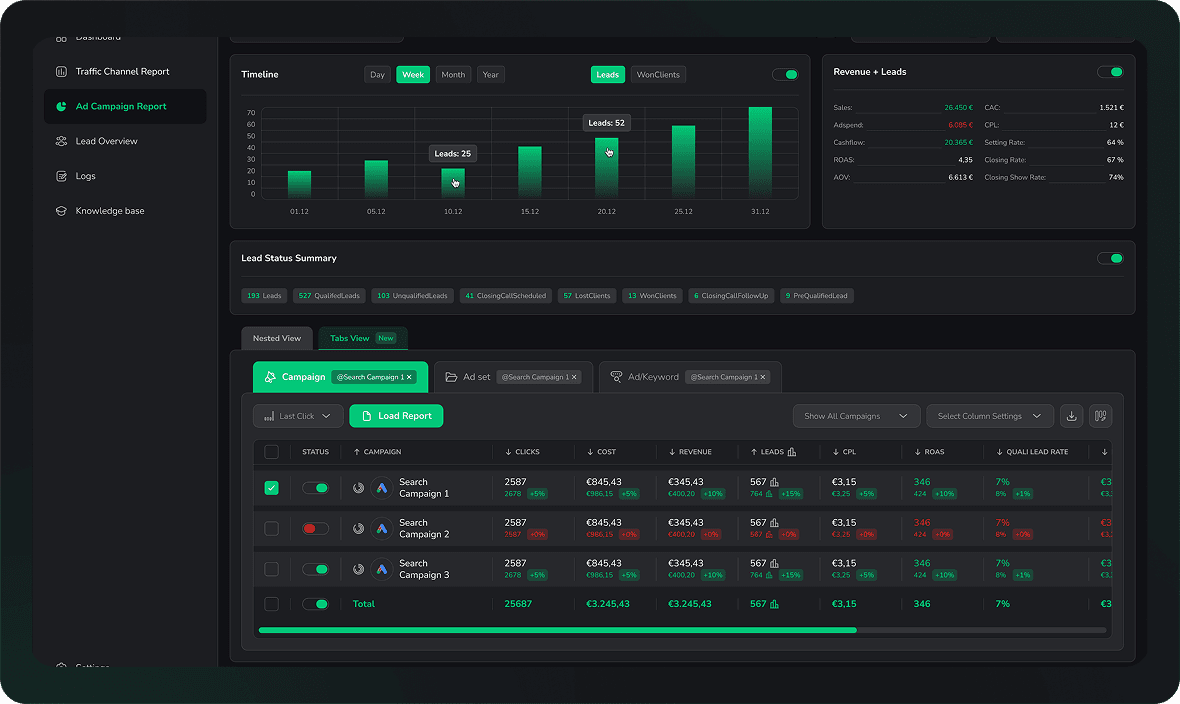
LeadJourney is an attribution platform, not an incrementality tool. It does not run lift studies, geo experiments or marketing mix models, has no holdout feature and does not report by region. What it does is the half of the test that lead gen usually lacks: the outcome. One script on the site or in GTM records every visit server-side on your own domain, first-party, at 95%+ tracking accuracy, captures the click ids (gclid, gbraid, wbraid, fbclid, li_fat_id, msclkid) at the click, and joins the anonymous history to the person at the form fill, call or booking.
Through native CRM integrations with HubSpot, Salesforce, Pipedrive, Zoho and more, the source, campaign and journey are written onto the CRM record, and stage changes and won deals are read back. That gives you two of the three columns in the worked example: the qualified leads and deals attributed to each channel, under any of five attribution models, and the spend pulled from the ad platforms beside them. The region comes from the CRM record, so the geo read is a CRM export.
It also closes the loop a platform study needs. Won deals go back to Meta through the Conversions API, to Google Ads through offline conversion import on the gclid, to LinkedIn through its Conversions API and to Microsoft Ads, each with the deal value. That lets the platforms optimise on deals, and if your Google or Meta lift study type accepts offline events, it gives the study a deal to read instead of a form fill. Consent is respected: a visitor who declines is not measured. Setup takes about 21 minutes, with a 14-day free trial.
Further Reading
The definitions: incrementality, attribution model, view-through conversion and return on ad spend. The decisions around a test: incrementality vs attribution, Meta incremental attribution and MMM vs MTA. The arithmetic: the incrementality calculator and the ROAS calculator. Why platform numbers run high: click-through vs view-through conversions and cross-channel attribution. On the product side: offline conversion tracking, multi-touch attribution and B2B marketing attribution.
FAQ
Frequently Asked Questions
What marketers ask before running their first incrementality test.
What is incrementality testing in marketing?
Incrementality testing measures how many conversions your ads caused, as opposed to how many happened after someone saw or clicked them. It works by withholding ads from a control group, either a random share of people or a set of regions, and comparing that group's outcome with the group that could see the ads. The difference, scaled to the size of the test group, is the incremental result. Attribution tells you which touchpoints came before a conversion; an incrementality test tells you whether the conversion would have happened without them.
How do you measure incrementality?
Compare a test group that can see your ads with a control group that cannot, on the same outcome over the same period. Incremental conversions are the test result minus what the control group predicts the test group would have done without ads, and lift is that difference divided by the prediction. For a geo test, the prediction is the holdout regions' result times the ratio between the two region sets in a pre-period. For lead gen, measure on qualified leads and deals from the CRM rather than on platform form fills.
What are the requirements for a Google Ads conversion lift study?
Google's help pages, read on 7 October 2026, say Conversion Lift is not available to every account and is set up through your Google account representative. A study based on users needs at least 1,000 observed conversions and a minimum campaign budget of $5,000 USD, runs on Display, Search, Video, Demand Gen, App and Performance Max campaigns, and should run for more than 14 days. A study based on geography accepts offline conversion data at ZIP or city level, needs campaigns targeting a single country and tends to need more budget.
How does a Meta conversion lift test work?
Meta's Experiments tool splits your audience into a test group that has the opportunity to see your ads and a holdout that is withheld from them, then reports the difference in conversions as lift. Meta suggests an estimated power of 80% before the test and treats a result at 90% confidence or more as statistically reliable. Conversion lift tests on standard web events require the Conversions API. Spend minimums are shown when you create the test; check there whether your study can read a CRM event such as a qualified lead.
What is a geo holdout test?
A geo holdout test switches a channel off in a set of regions, the holdout, and keeps it on in comparable regions, then compares results. Because the split is by location rather than by person, it needs no platform cooperation: you exclude the holdout regions in location targeting and count the outcome by region in your CRM. It is noisier than a randomised user-level test and needs more regions and more weeks, but it can read any outcome you can count by region, including deals and revenue.
How long should an incrementality test run?
Long enough to collect the conversions the test needs and to cover at least one buying cycle. Google recommends more than 14 days for its own studies and Meta's GeoLift guidance at least 15 days on daily data. For lead generation, four to eight weeks is realistic for qualified leads, and the deals from those leads need roughly one more sales cycle before you read them. A pre-period of several times the test length, with the channel on everywhere, comes before the test.
Keep reading
More from the blog
 How To Guides
Pipedrive Lead Source Tracking: Source Origin vs Source Channel
Pipedrive gives every lead and deal three source fields: an origin the system sets, a channel a person picks and a free text ID. What each one records, the five ways the report still goes wrong, and how to put a measured first touch on the deal.Read the article11 min read How To Guides
Pipedrive UTM Parameters: Hidden Fields, Web Forms and Deals
Pipedrive has no UTM field and its Web Forms documentation says nothing about hidden fields. How teams get utm_source and the click ID onto the Lead and the Deal anyway, the naming that keeps it reportable, and why first touch needs its own fields.Read the article11 min read How To Guides
Pipedrive Google Ads Integration: gclid and Offline Conversions
We could not find a Google Ads integration built by Pipedrive. What exists is a set of marketplace apps, a Zapier template and attribution tools, and all of them have to close the same loop: capture the gclid, keep it on the deal, upload the won deal with its value inside 90 days.Read the article11 min read
The outcome your test reads
Read your next lift test on deals, not form fills
LeadJourney joins every click to the CRM lead and deal, reports qualified leads and revenue per channel and sends won deals back to Meta, Google, LinkedIn and Microsoft. Live in 21 minutes, 14 days free.