














BlogB2B Marketing Attribution
Cross-Channel Attribution: What It Is and Why It Breaks
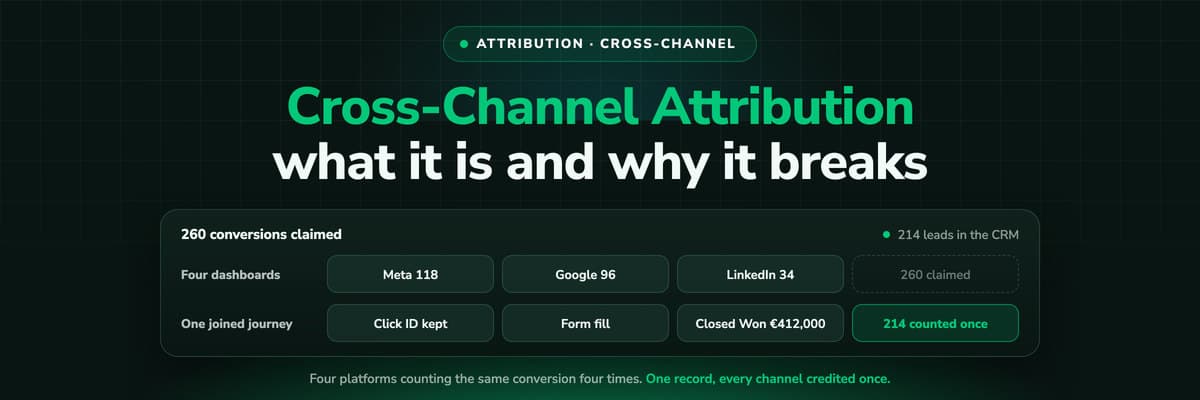
Meta claims 118 conversions, Google claims 96, LinkedIn 34 and Microsoft 12. The CRM has 214 leads. Cross-channel attribution is the work of turning four honest, incompatible answers into one, and this guide covers the four methods that try it, what each of them can and cannot see, and the setup that decides whether any of them holds.

Contents
Summarise this article with AI
Opens the page with a ready prompt in:


Nothing is sent until you pick a service.
Here is a month of a lead generation account. The figures are an example rather than one customer's books, but the shape is the ordinary one. €38,000 of spend across four platforms: €16,000 on Google Ads, €14,000 on Meta, €6,000 on LinkedIn, €2,000 on Microsoft Advertising. At the end of it, Meta Ads Manager reports 118 conversions, Google Ads reports 96, LinkedIn Campaign Manager reports 34 and Microsoft reports 12. That is 260 conversions. The CRM has 214 paid leads, of which 31 closed for €412,000.
Nobody is lying. Each platform counted the conversions it could see inside its own window, under its own model, and every one of those four numbers is defensible on its own terms. They are simply four answers to four different questions, and none of them is the question the person paying for the ads is asking: which channel should get the next €10,000.
Cross-channel attribution is the work of getting to that one answer. This guide covers what it actually means (and how it differs from the three terms it gets confused with), why the platforms structurally cannot add up, the four methods teams use to measure across channels, what the same journey looks like under six different models, and the setup that decides whether any of it survives contact with a real sales cycle.
Quick Summary: Cross-Channel Attribution in One Paragraph
In short
Cross-channel attribution is the practice of crediting a single conversion across every marketing channel that contributed to it, instead of letting each ad platform claim it separately. It is hard because the platforms are walled gardens: each one sees only its own clicks, applies its own attribution window and model, and counts a conversion it touched even when three other channels touched it too. The fix is not a better model, it is a better record. One first-party journey per person, collected server-side so the click IDs survive, joined to one identity at the form fill and carried through the CRM to closed revenue. Once that record exists, first click, last click, linear, position-based and time decay are five views of the same data rather than five arguments. LeadJourney builds that record at 95%+ tracking accuracy, with the attribution model as a switch on every report and a 21 minute setup.
What Is Cross-Channel Attribution?
Cross-channel attribution is a measurement method that assigns credit for one conversion across all the marketing channels a person encountered on the way to it: paid search, paid social, organic, email, referral, direct and offline. Its defining feature is not the number of touchpoints it counts. It is that the credit is assigned once, from outside the platforms, so the total across channels equals the number of conversions that actually happened.
That last part is what separates it from platform reporting, and it is the whole difficulty. Meta cannot know that the person who clicked its ad on Tuesday had already clicked a Google ad the week before, because Google will not tell it. Neither will LinkedIn. So each platform reports on the assumption that it was the only channel in the room, and the sum of four such reports is always larger than reality.
Four terms get used interchangeably here and they mean four different things. Getting them apart is worth two minutes, because a tool that solves one of them does not solve the others.
- Cross-channel attributionSplitting the credit for one conversion between the channels involved. Answers: what is Meta worth compared to Google, on the same conversion, counted once.
- Multi-channel marketingRunning campaigns on several channels at once. A description of your media plan, not a measurement method. You can be multi-channel and still measure everything last click.
- Multi-touch attributionSplitting credit between the touchpoints in one journey. The mechanism cross-channel attribution usually runs on, but it is about touches; those touches can all be on one channel.
- Cross-device trackingKeeping the journey intact when the same person moves from phone to laptop. A prerequisite. Without it, one journey becomes two and every model downstream is wrong.
The short version
Multi-touch is how you split the credit. Cross-device is what keeps the journey in one piece. Cross-channel is the question you are trying to answer with both of them.
Why the Channels Never Add Up
Back to the month in the intro. Here is where each of those 260 conversions came from, and what the dashboard reporting it could not see. The windows and models below are each platform's documented default, and all four are configurable, so check yours before quoting these back at anyone.
One month of paid activity: 260 claimed conversions against 214 leads in the CRM
| Where the number comes from | Conversions claimed | Default window and model | Blind to |
|---|---|---|---|
| Meta Ads Manager | 118 | 7-day click, 1-day view | Any journey that also touched Google, LinkedIn or organic |
| Google Ads | 96 | 30-day click, data-driven | The Meta ad that opened the journey three weeks earlier |
| LinkedIn Campaign Manager | 34 | 30-day click, 7-day view | Everything that happened off LinkedIn |
| Microsoft Advertising | 12 | 30-day click | Everything that happened off Bing |
| The four added up | 260 | Four models at the same time | That 46 of these leads do not exist |
| The CRM | 214 | The whole journey, once | Nothing, once the journey is joined to the person |
The gap here is 21%, which for lead generation is ordinary. In e-commerce, where retargeting overlap is heavier, the same table routinely shows 150% or more. Either way the arithmetic is the point: you cannot allocate a budget from a set of numbers whose sum exceeds the thing being divided.
Five structural reasons produce that gap, and only one of them is a tracking bug you can fix by installing something.
- Each platform is a walled garden. Meta, Google, LinkedIn and Microsoft do not exchange user-level data with each other, by design and increasingly by law. Every one of them therefore reports as though it were the only channel running.
- The windows are different lengths. A conversion 20 days after the click is inside Google's 30-day window and outside Meta's 7-day one. The same person, the same purchase, counted by one platform and missed by the other, with neither of them wrong.
- View-through counts as a touch on some platforms and not others. Meta credits a conversion within a day of an impression nobody clicked. Google Ads does not do that for search. So a channel that runs display gets a category of credit that a search channel structurally cannot earn.
- There is no shared identifier. The join key that would let two platforms agree it was the same person is exactly the thing that ITP, iOS and consent tooling removed. A browser cookie set in JavaScript is capped at seven days in Safari, which is shorter than most B2B consideration cycles.
- The conversion the platform counts is not the outcome you sell. A form fill is a form fill. It is not a qualified lead, and it is certainly not €13,290 of closed revenue. Optimising four platforms against a proxy is how an account ends up with a falling cost per lead and a flat pipeline.
The first three are facts about the industry and no tool changes them. The last two are the ones you can act on, and they are the same fix: collect the journey yourself, first-party, and carry it to the outcome that pays the bills. We wrote up the reconciliation side of this in why GA4, Meta and Google conversions never match your CRM.
The Four Ways Teams Measure Across Channels
There are exactly four answers in commercial use, and the industry argument about which is best is mostly an argument between people with different data and different budgets. They answer different questions and the mature setups run two of them side by side.
What each method needs, what it answers and where it stops
| Method | What it needs | What it answers | Where it fails | First answer in |
|---|---|---|---|---|
| Platform-reported | Nothing, it is already switched on | Did this platform's own ads produce conversions it could see | Every journey that crosses a channel, which is most of them | Immediately |
| Multi-touch attribution | First-party tracking, one identity per person, CRM revenue | Which channels appear in the journeys that close, and in what order | Impressions nobody clicked, offline media, walled-garden views | Days |
| Marketing mix modelling | Commonly two years or more of weekly spend and outcome data | How much each channel moves the total, including offline and brand | One campaign, one lead, this week's decision | Months |
| Incrementality testing | Budget you are willing to hold out, or a clean geo split | Whether the channel caused the lift, rather than took credit for it | Continuous per-campaign reporting, and small accounts | Weeks |
For a business under roughly €100,000 a month in spend, marketing mix modelling is not an option: there is not enough weekly variance in the data for a model to learn from, and the answer arrives after the quarter it was meant to inform. Incrementality testing is affordable at any size but it is an experiment, not a report, so it tells you something true about one channel once rather than something usable about all of them every Monday.
That leaves multi-touch attribution as the operating layer for almost everyone reading this, with incrementality as the periodic audit that keeps it honest. The rest of this guide is about making the multi-touch layer trustworthy, because a multi-touch model over incomplete data is worse than last click: it is wrong with more decimal places.
One Journey, Six Different Answers
Once the journey is in one piece, the model is a policy choice about how to split the credit, and choosing one is the easiest part of the job. Here is a real shape of B2B journey: a €18,400 deal, five touchpoints over 24 days, closed on day 52.
- Day 0. Google Ads, non-brand search. The prospect has a problem and is searching for a category.
- Day 3. LinkedIn Ads. A sponsored post in the feed, clicked, two minutes on the site, no form.
- Day 11. Organic search. Lands on a comparison article, reads it, leaves.
- Day 19. Meta retargeting. Clicked, back on the pricing page.
- Day 24. Google Ads, brand search. Types the company name, clicks the ad above the organic result, books a demo.
Five channels, one deal, €18,400. Every column below is a legitimate way to divide it and they disagree by an order of magnitude.
€18,400 of closed revenue, split five ways, five times
| Touchpoint | First click | Last click | Linear | Position-based | Time decay |
|---|---|---|---|---|---|
| Google Ads, non-brand (day 0) | €18,400 | €0 | €3,680 | €7,360 | €813 |
| LinkedIn Ads (day 3) | €0 | €0 | €3,680 | €1,227 | €1,093 |
| Organic search (day 11) | €0 | €0 | €3,680 | €1,227 | €2,414 |
| Meta retargeting (day 19) | €0 | €0 | €3,680 | €1,226 | €5,332 |
| Google Ads, brand (day 24) | €0 | €18,400 | €3,680 | €7,360 | €8,748 |
Read the two Google rows. Under last click the brand campaign earns the entire €18,400, which is how brand search ends up looking like the best performing campaign in almost every account: it is the last thing a decided buyer touches, and it converts people who were already coming. Under first click the non-brand campaign that actually created the demand earns all of it and the brand campaign earns nothing. Both are the same €18,400 and both are indefensible as the only number you look at.
The middle three are the useful ones. Linear makes no assumption at all, which makes it the honest default and the one to start on. Position-based gives 40% each to the first and last touch and splits 20% across the middle, on the argument that starting and closing a journey are the hard parts. Time decay weights by recency on a seven-day half-life, which suits short cycles and systematically starves anything that happened in month one of a six month deal.
Data-driven attribution is the sixth, and it has no column here on purpose. It computes the split from your own account's converting and non-converting paths, so there is no fixed percentage to print: the answer is different for every advertiser and it changes as the data changes. It needs volume to be stable, and on a lead generation account doing a few hundred conversions a month it will move around more than the decisions it is meant to support.
The point of switchable models
Nobody should have to pick one and live with it. The useful question is which channels change position when you switch the model, because a channel that looks strong under every model is genuinely strong, and one that only wins under last click is being paid for work someone else did.
How to Build Cross-Channel Attribution That Holds
Six steps, in this order. The order matters more than the tooling: every step depends on the one above it, and a team that starts at step five builds a model over data that cannot carry it.
- Collect the touchpoints yourself, server-side. Browser pixels lose 30 to 60% of events to iOS, Safari's ITP, ad blockers and consent tooling, and the losses are not evenly spread across channels, so they bias the comparison you are trying to make. Server-side collection on your own domain is what puts the accuracy in the nineties instead of the sixties.
- Keep the click IDs at the moment of the click. gclid with gbraid and wbraid, fbclid, li_fat_id, msclkid, plus the UTM parameters and the landing page. These are the only identifiers that tie a visit back to a specific ad, and they are read once, at the first visit, before anything has had a chance to clear them. How the gclid works is the long version.
- Resolve the anonymous visitor to one person. The form fill, the call or the booking is the moment the journey gets a name. Everything before it that belonged to the same visitor gets attached to that person, which is also what keeps a phone-then-laptop journey as one journey instead of two.
- Write the source onto the CRM record, not into a report. The ad, campaign, channel and landing page belong on the contact and the deal, in HubSpot, Salesforce, Pipedrive or whatever you run. A source that lives only in an analytics tool cannot be filtered by a sales manager and will not survive the next tool change.
- Model on revenue, not on conversions. Credit the closed amount and the pipeline stage, not the form fill. This is the step that changes budget decisions, because the channel with the cheapest leads and the channel with the best cost per closed customer are frequently not the same channel.
- Send the outcome back to the platforms. Once you know which leads closed, the Conversions API on each platform can optimise on that instead of on form fills. This is the part that makes cross-channel measurement pay for itself rather than just describe the account.
Note what is not on the list: choosing a model. That is step seven, it takes an afternoon, and it is reversible. Steps one to four are the ones that cost time and cannot be retrofitted, because the data you did not collect in March is not available in June.
The Same €38,000, Under Four Different Verdicts
Back to the month from the intro one last time, with the journeys joined. €38,000 of spend, 214 leads, 31 closed deals, €412,000 of closed revenue. Here is that revenue credited four ways, with the return on ad spend each verdict implies.
€412,000 of closed revenue credited four ways, with the implied ROAS per channel
| Channel | Spend | Platform-reported | Last click | First click | Linear |
|---|---|---|---|---|---|
| Meta Ads | €14,000 | €187,000 · 13.4x | €96,700 · 6.9x | €178,600 · 12.8x | €142,300 · 10.2x |
| Google Ads | €16,000 | €152,100 · 9.5x | €214,200 · 13.4x | €121,900 · 7.6x | €154,700 · 9.7x |
| LinkedIn Ads | €6,000 | €53,900 · 9.0x | €48,300 · 8.1x | €79,400 · 13.2x | €62,800 · 10.5x |
| Microsoft Ads | €2,000 | €19,000 · 9.5x | €12,400 · 6.2x | €18,700 · 9.4x | €15,900 · 8.0x |
| Organic and direct | None | Not counted | €40,400 | €13,400 | €36,300 |
Three things fall out of that table, and none of them is visible in any single ad platform.
- Meta is the best channel in Ads Manager and the worst under last click. 13.4x against 6.9x, on the same spend and the same month. Both figures are arithmetically correct. Meta opens journeys and rarely closes them, so a platform-reported view flatters it and a last-click view buries it.
- Google Ads is the mirror image. It looks average in its own dashboard and best under last click, because brand search sits at the end of journeys that other channels started. Cutting Meta on the last-click number is how accounts quietly kill their own brand search volume six weeks later.
- LinkedIn only pays under first click. 13.2x against 8.1x under last click. For a channel with a €14 cost per click and a three month sales cycle, first click is not a flattering model, it is a more accurate description of what the channel does.
Under every model, the €412,000 sums correctly and the sum stays €412,000. That is the whole benefit of measuring outside the platforms: the argument moves from whose number is right to which split of one agreed number best describes what happened.
What to Look For in a Cross-Channel Attribution Tool
Every tool in the category says it does cross-channel attribution. Seven questions separate the ones that do it from the ones that aggregate four dashboards into one screen and leave the double counting intact.
- Where is the click ID captured? Server-side on your own domain, or in the visitor's browser. This one question decides the accuracy ceiling and everything downstream of it. Ask for the mechanism, not for the presence of the words on a pricing page.
- Does it read your CRM, or only your website? A tool that stops at the form fill can only model form fills. If closed revenue is not in the model, the output is a cost per lead report wearing an attribution label.
- Can you switch the model on a report you are already looking at? If changing from last click to linear needs a support ticket or a re-import, nobody will ever do it, and the comparison in the table above is where the insight actually lives.
- Does it show a single named journey, end to end? Channel totals are the summary. The moment somebody disputes the number, you need one lead's actual sequence of touches on screen, with dates.
- Does the credit reach the ad platforms again? Conversions API support for Meta, Google, LinkedIn and Microsoft, firing on the CRM stage rather than the form fill. Measurement that does not feed back into bidding is a report, not a system.
- Where is the data hosted, and under whose contract? For anyone in the EU this is a procurement question before it is a technical one, and it is worth settling before an implementation rather than after.
- How long is the setup, honestly? If the answer involves a data engineer and a quarter, the model will be obsolete before the first report. If it involves an afternoon, ask what is being skipped.
If you are comparing named products, the best B2B attribution software and the best lead attribution tools run those questions against the tools in the market.
Verdict
Cross-channel attribution is not a modelling problem, it is a record-keeping problem with a modelling step at the end. Get the journey right and any model tells you something useful; get it wrong and no model rescues it.
How LeadJourney Does Cross-Channel Attribution
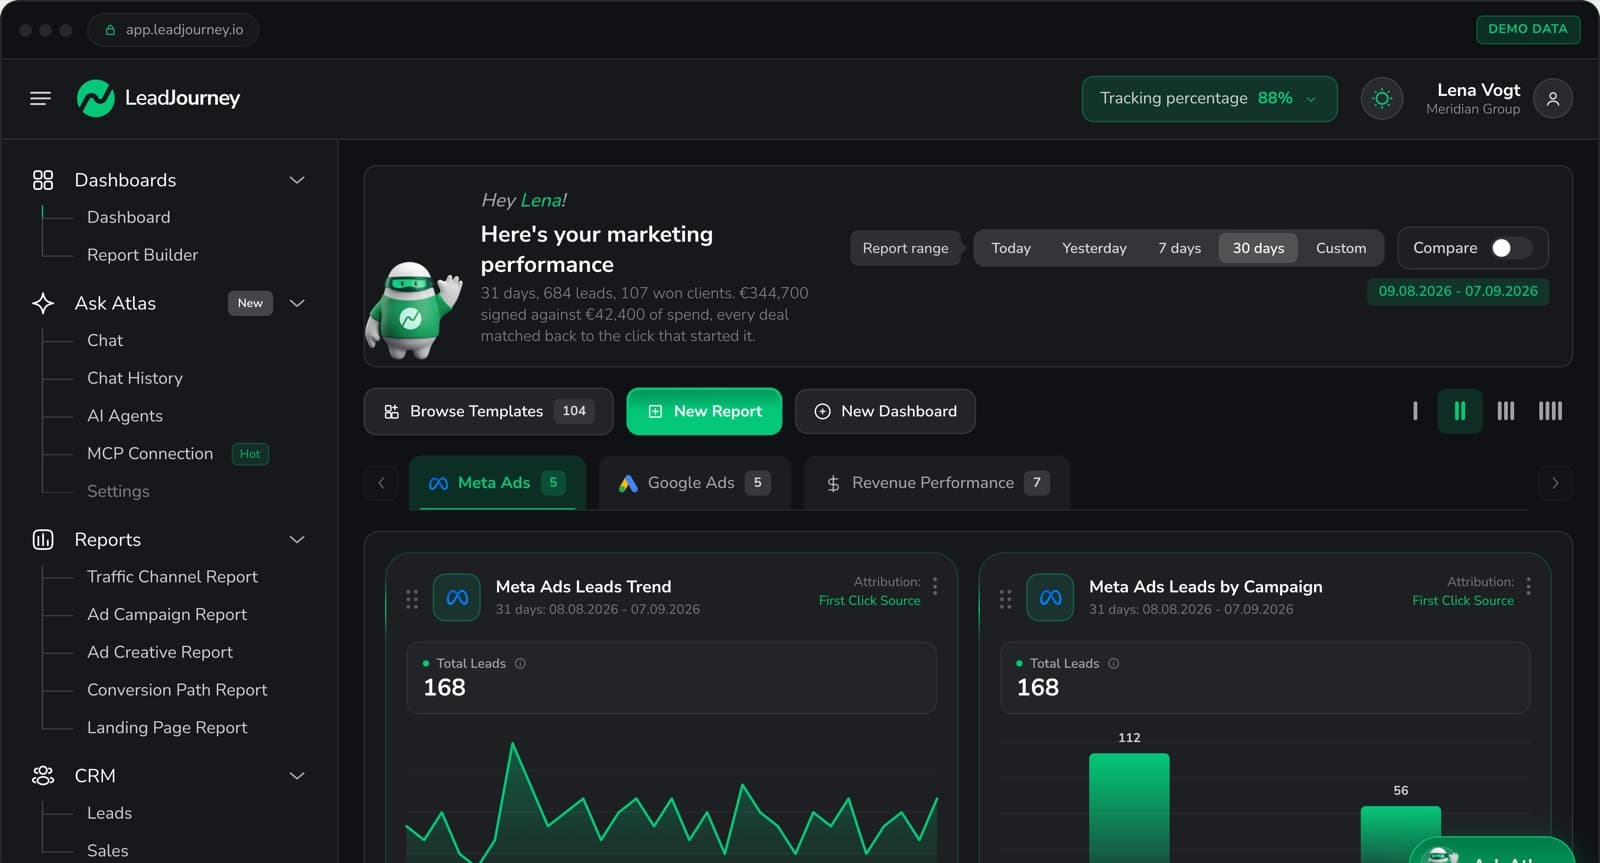
Tracking runs server-side on your own domain at 95%+ accuracy, so the click IDs are read at the first visit and kept: gclid with gbraid and wbraid, fbclid, li_fat_id and msclkid, plus the UTM parameters and the landing page. That anonymous first visit is joined to a person at the form fill, the call or the booking, and from there the record follows your CRM stages to the closed deal. Native integrations cover HubSpot, Salesforce, Pipedrive, Close, Attio, GoHighLevel, ActiveCampaign and Odoo, and anything else connects by webhook.
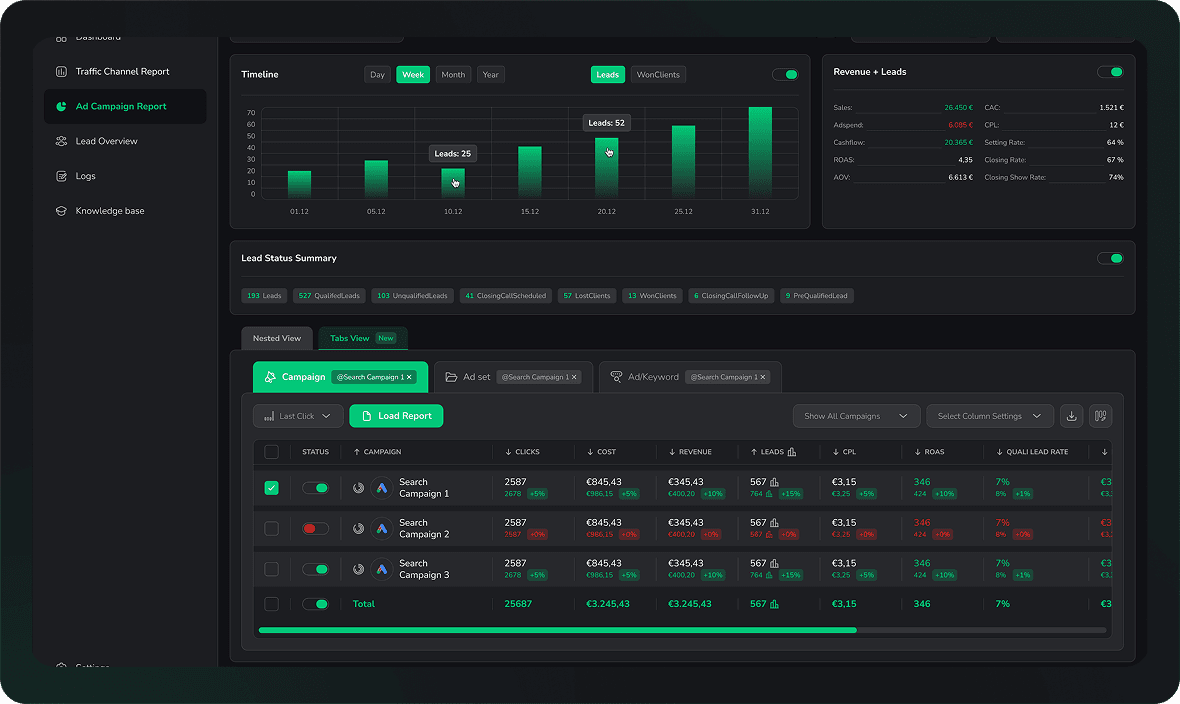
Because every channel is measured against that one record, the channel report adds up: spend, visits, leads, customers and CRM revenue in one table, with a switch that moves the whole report between first click, last click, linear, position-based and multi-touch. The same switch sits on the campaign report, which is where the argument in the worked example above is usually settled: the same campaigns, both models, side by side. The Chrome extension brings that CRM revenue, with a first click, last click and multi-touch switch, into Meta Ads Manager and Google Ads themselves.
The loop then closes in the other direction. Once a lead reaches a stage that matters, that outcome goes back to Meta, Google, LinkedIn and Microsoft through the Conversions API, so the platforms optimise toward the leads that closed rather than the forms that submitted. Setup takes about 21 minutes, and you can click through the whole product on demo data before talking to anybody: the attribution switch on the campaign report is on the third screen.
Further Reading
Related reading: multi-touch attribution for the models as a product feature, multi-touch attribution for B2B lead generation for long sales cycles specifically, why GA4, Meta and Google conversions never match your CRM for the reconciliation side, server-side versus browser tracking for why collection sets the ceiling, the best cross-device tracking solutions for keeping a journey in one piece, customer journey tracking for the record itself, one truth across every ad platform for the reporting version of this problem, and marketing attribution software for the category page.
FAQ
Frequently Asked Questions
What marketing leads ask before rebuilding how their channels are measured.
What is cross-channel attribution in simple terms?
It is crediting one conversion across every channel that helped produce it, counted once, from outside the ad platforms. If a person clicked a Google ad, then a LinkedIn ad, then a Meta retargeting ad before booking a demo, cross-channel attribution decides how much of that booking each of the three earned. Platform reporting does not do this: each platform claims the conversion in full, which is why four dashboards routinely report more conversions than your CRM has leads.
What is the difference between cross-channel and multi-channel attribution?
In practice the two terms are used for the same thing, and most vendors treat them as synonyms. Where people do distinguish them, multi-channel describes reporting that lists several channels next to each other, while cross-channel describes splitting one conversion between them. The more useful distinction is with multi-touch attribution, which is about the touchpoints in a journey rather than the channels, and with cross-device tracking, which is about keeping one person's journey intact when they change device.
What is the difference between MTA and MMM?
Multi-touch attribution works bottom up from individual user journeys, so it can tell you which campaign produced a specific lead, and it needs first-party tracking and identity to do so. Marketing mix modelling works top down from aggregate weekly spend and outcomes, so it needs no user-level data at all, it can measure offline and brand media, and it cannot tell you anything about one lead or one week. MTA is the operating report, MMM is the annual planning tool, and they need roughly €100,000 a month of spend and two years of history before MMM becomes viable.
Why do Meta, Google and LinkedIn all claim the same conversion?
Because none of them can see the others. Each platform counts a conversion that happened within its own attribution window after an interaction with its own ads, and it has no way to know that three other platforms also touched the same person. On top of that the windows differ (7-day click on Meta by default against 30 days on Google, LinkedIn and Microsoft) and some platforms count view-through conversions while others do not. Adding four such figures together is not a total, it is four overlapping counts.
Can GA4 do cross-channel attribution?
Partly. GA4 sees organic, direct, referral and any campaign you tagged with UTM parameters, so it is genuinely cross-channel in scope and it is free. What it does not have is ad spend, CRM revenue or the identity resolution to follow a person to a closed deal, and its default reporting model is last non-direct click. It answers which channel a session came from. It does not answer what a channel earned, which is the question a budget decision needs.
Which attribution model should we use across channels?
Start on linear, because it makes no assumption you would have to defend, then compare it against first click and last click on the same report. What matters is not the model you settle on but which channels change rank when you switch: a channel that performs under every model is genuinely performing, and one that only wins under last click is taking credit for demand another channel created. Data-driven models are worth having once your conversion volume is high and stable enough for the split to stop moving week to week.
How long does it take to set up cross-channel attribution?
The tracking and CRM connection is an afternoon of work with a modern tool: LeadJourney takes about 21 minutes to connect the ad platforms and the CRM. What takes longer is the data itself. Attribution is only as long as your history, so a business with a three month sales cycle sees its first fully closed-loop month roughly a quarter after switching on. That is an argument for starting now rather than for waiting until the model is perfect.
Keep reading
More from the blog
 B2B Marketing Attribution
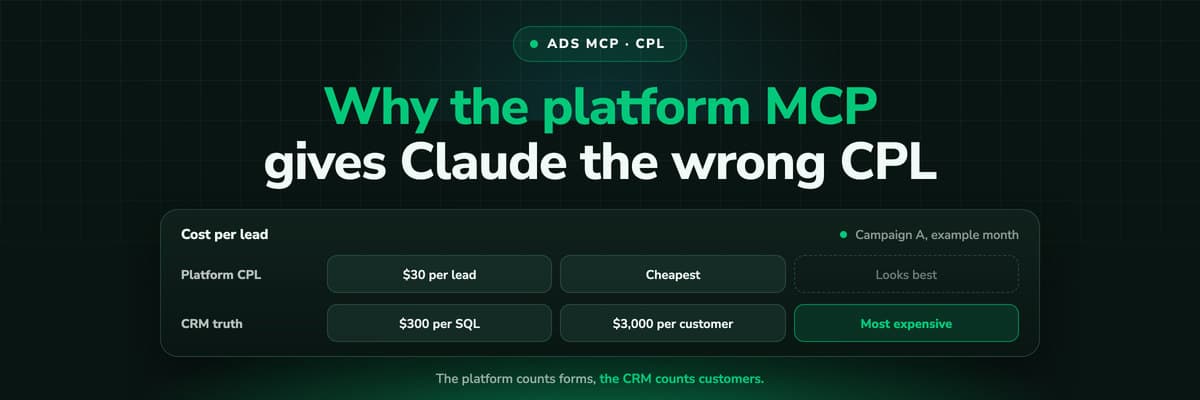
Why Your Ad Platform's MCP Gives Claude the Wrong CPL
Connect Claude to Meta or Google Ads through MCP and ask which campaign is cheapest per lead: it will answer correctly, by the platform's count. A worked example of why that campaign can be the most expensive per customer, what the platform's conversion column actually counts, and how to give Claude the CRM side.Read the article12 min read B2B Marketing Attribution
Meta Ads MCP Plus Your CRM: Which Campaigns Made Revenue
Meta's MCP server can read and draft campaigns, but it cannot see which leads closed. Put LeadJourney's MCP server in the same Claude conversation and every question can be asked on closed revenue. A worked example, the workflow step by step, and the guardrails that keep a person in charge of every change.Read the article12 min read B2B Marketing Attribution
Which Ad Copy Attracts Leads That Close
The ad copy that wins on cost per lead is often the copy that fills the CRM with people who never buy. How to measure wording on qualification rate and close rate per ad, design a copy test that can answer, and do the sample size arithmetic before you crown a winner on five deals.Read the article12 min read
Every channel, counted once
Ready to stop adding up four dashboards that disagree?
LeadJourney captures every click ID server-side, joins it to the person at the form fill and follows your CRM stages to closed revenue, so first click, last click and multi-touch are one switch on the same report. Live in 21 minutes.
30-day money-back guaranteeSetup with a tracking expert