





Skip to content

Free tool: incremental lift

Incrementality calculator: the conversions your ads actually caused

Enter a test group and a holdout. You get the lift, the incremental conversions, iROAS and a plain answer on whether the result is proven yet.

Calculate incremental lift

The test group saw the ads, the holdout did not. Enter both groups to see the lift, what it is worth and whether it is proven.

Currency

Enter results as

People (or users) eligible to see the ads.

Leads, qualified leads or deals.

The holdout: kept from the ads.

The same outcome, counted the same way.

€

Adds incremental cost per conversion.

€

Adds incremental revenue and iROAS.

How the significance read works

A two-proportion z-test asks how likely a gap this size would be if the ads changed nothing. Under 5 percent (95 percent confidence) the lift counts as proven; above it, the test has not told you yet. It assumes people were split at random, so it does not fit a geo test, where regions are the unit.

Runs in your browser. Nothing you type is sent or stored.

The formula

The incremental lift formula

Lift=Test conversion rate minus control conversion rateControl conversion rate× 100

600 conversions from 50,000 people in the test group is 1.2 percent; 480 from 50,000 in the holdout is 0.96 percent. Lift = (1.2 minus 0.96) ÷ 0.96 = 25 percent, and the ads caused (1.2% minus 0.96%) × 50,000 = 120 conversions.

What incrementality measures

Incrementality is the share of your results that would not have happened without the ads. Attribution answers a different question, which touchpoints led to a conversion, and credits a retargeting ad or a brand search click even when the person was coming anyway. A holdout test answers the incremental one directly: show the ads to one group, keep them from a comparable group, and the difference between the two is what the ads caused.

You need both. Attribution runs every day and tells you which campaign, keyword or creative to change; a lift test runs a few times a year and tells you how much a channel is really worth. The incrementality vs attribution post covers which question each answers, and the glossary entry defines the terms on this page.

How to calculate incremental lift, iROAS and incremental CPA

Start from the two conversion rates, conversions divided by group size, because the groups are rarely the same size. Lift is the gap between them divided by the control rate. Incremental conversions are the same gap multiplied by the size of the test group: the conversions the ads added on top of what the test group would have done anyway.

Everything else divides by that count. Incremental cost per conversion is the spend in the test group divided by the incremental conversions; in the example above, €15,000 over 120 is €125. Incremental ROAS is the revenue of those conversions divided by spend: 120 conversions at €400 is €48,000, an iROAS of 3.2x. Your platform's ROAS for the same campaign will be higher, because it also credits the 600 minus 120 conversions that would have happened without the ads.

Is the lift real: significance in plain words

Two groups never convert at exactly the same rate, even when the ads do nothing. The calculator runs a two-proportion z-test, which asks how often a gap this size would appear by chance alone. Below 5 percent (95 percent confidence) the lift counts as proven; above it, the honest reading is not proven yet, which is not the same as no lift.

Sample size decides most of it. The example above, 600 against 480 out of 50,000 each, is proven well past 99.9 percent. The same rates on smaller groups, 130 against 110 out of 10,000 each, give an 18.2 percent lift at only 81 percent confidence. When a result is not proven, the calculator prints how many people per group a difference that size needs, at 95 percent confidence and 80 percent power, so you can decide whether to extend the test or accept that the effect is small.

  • The z-test assumes people were split at random, as in a platform conversion lift study or a user-level holdout.
  • A geo test randomises regions, not people, so a test on individual conversions overstates its confidence. Use the method the geo tool ships with; incrementality testing covers the designs.
  • Decide the length and the outcome before the test starts. Stopping the day the number turns green makes chance look like lift.

Lift for lead generation: count the right conversion

A lift test is only as good as its outcome metric. In lead generation the pixel counts form fills, and a campaign can lift form fills while adding nothing to qualified leads or deals, because the extra forms come from people sales will never close. The outcome worth testing on lives in the CRM.

Long sales cycles make that harder, not optional. Read the test first on qualified leads or pipeline, which arrive within weeks, and again on won revenue once the deals have had time to close. The calculator takes any count, so run it once per stage and see where the lift holds.

Where LeadJourney fits, and where it does not

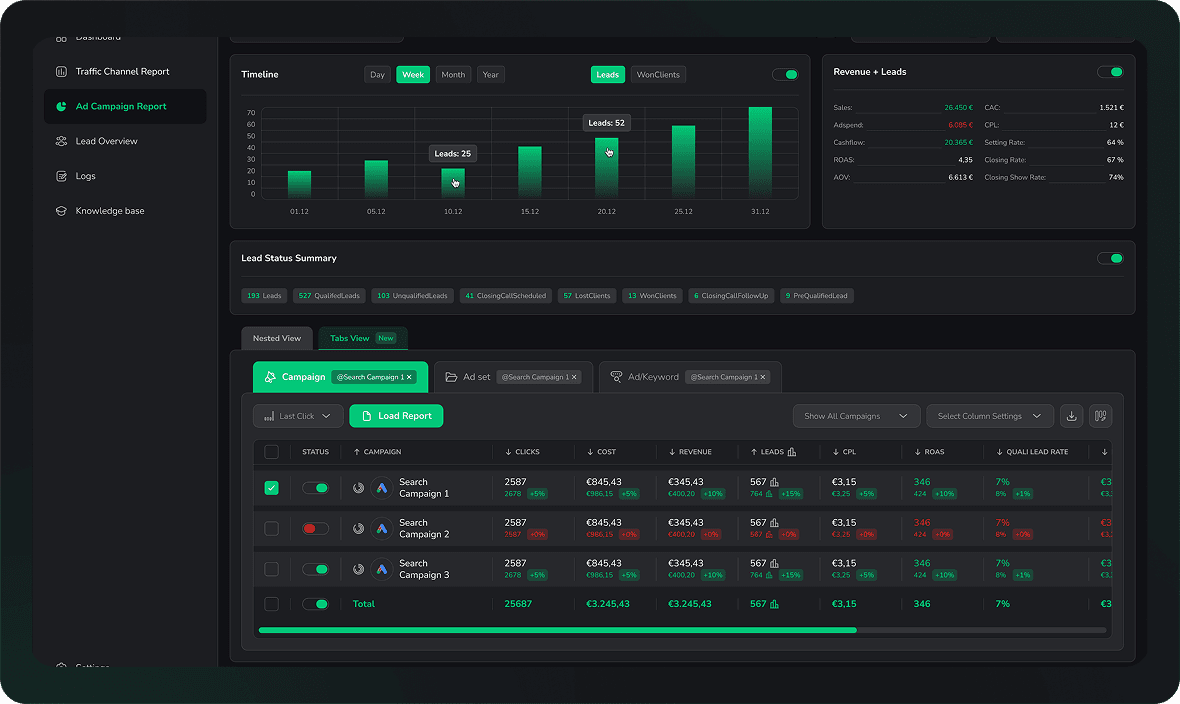
LeadJourney does not run lift tests, has no holdout feature and does not build media mix models. What it does is the measurement a lift test on lead gen depends on: every visit recorded first-party and server-side, the click ids captured at the click, the lead joined to its CRM record, and qualified leads, deals and revenue reported per channel and campaign.

It also sends won deals back to Meta through the Conversions API and to Google Ads through offline conversion import, so a platform's own reporting can be read on deals rather than form fills. Whether a given lift study accepts those offline events as its outcome is set by the platform, so check your study type before you plan around it.

FAQ

Incrementality and lift, answered

The questions behind the search for an incrementality formula.

How do you calculate incremental lift?

Divide each group's conversions by its size to get two conversion rates. Lift = (test rate minus control rate) ÷ control rate. 1.2 percent in the test group against 0.96 percent in the holdout is (1.2 minus 0.96) ÷ 0.96 = 25 percent. Use rates rather than raw counts, because the test and control groups are rarely the same size, and check the significance before you quote the number to anyone.

How do you calculate incremental conversions?

Multiply the gap between the two conversion rates by the size of the test group. With 1.2 percent against 0.96 percent and 50,000 people in the test group, that is 0.24 percent of 50,000, or 120 conversions the ads caused. The other 480 conversions in the test group would have happened anyway, which is exactly what platform attribution cannot tell apart from the 120.

What is the incremental ROAS formula?

iROAS = incremental revenue ÷ ad spend, where incremental revenue is the incremental conversions times the revenue per conversion. 120 incremental conversions at €400 is €48,000; on €15,000 of spend that is 3.2x. Ordinary ROAS divides all attributed revenue by spend, including conversions that would have happened without the ads, so it is almost always higher than iROAS. An iROAS under 1.0x means the ads cost more than the revenue they added.

How do I know if my lift test result is statistically significant?

Run a two-proportion z-test on the two groups, which this calculator does. It gives a p-value: the chance of seeing a gap this size if the ads did nothing. Under 0.05 is the usual line for 95 percent confidence. Above it, the result is not proven yet: the lift may be real but too small for the sample to show. The calculator then prints roughly how many people per group a difference that size needs.

How big should the holdout group be?

Big enough to detect the lift you expect, which depends on the base conversion rate and the size of the effect. Rare conversions and small lifts need large groups: at around 1 percent conversion, proving a 25 percent lift takes roughly 29,000 people per group at 95 percent confidence and 80 percent power. A smaller holdout costs fewer lost conversions but needs a bigger test group or a longer run to reach the same confidence.

Can I use this calculator for a geo test?

For the lift arithmetic, yes: enter the test regions' and control regions' totals. For the significance read, no. A geo test randomises a handful of regions, not thousands of people, and the z-test here treats every person as an independent draw, so it overstates confidence. Geo tests are read with methods built for them, such as synthetic control, which is what the dedicated geo tools use.

Lift on CRM outcomes

Test on deals, not on form fills

LeadJourney does not run the test. It records qualified leads, deals and revenue per campaign from your CRM, so the outcome you test on is the one that pays. Book a demo on your own account.

LeadJourney dashboard showing lead sources, campaign performance and attributed revenue side by side