














BlogB2B Marketing Attribution
Which Ad Copy Attracts Leads That Close
The ad copy that wins on cost per lead is often the copy that fills the CRM with people who never buy. How to measure wording on qualification rate and close rate per ad, design a copy test that can answer, and do the sample size arithmetic before you crown a winner on five deals.

Contents
Summarise this article with AI
Opens the page with a ready prompt in:


Nothing is sent until you pick a service.
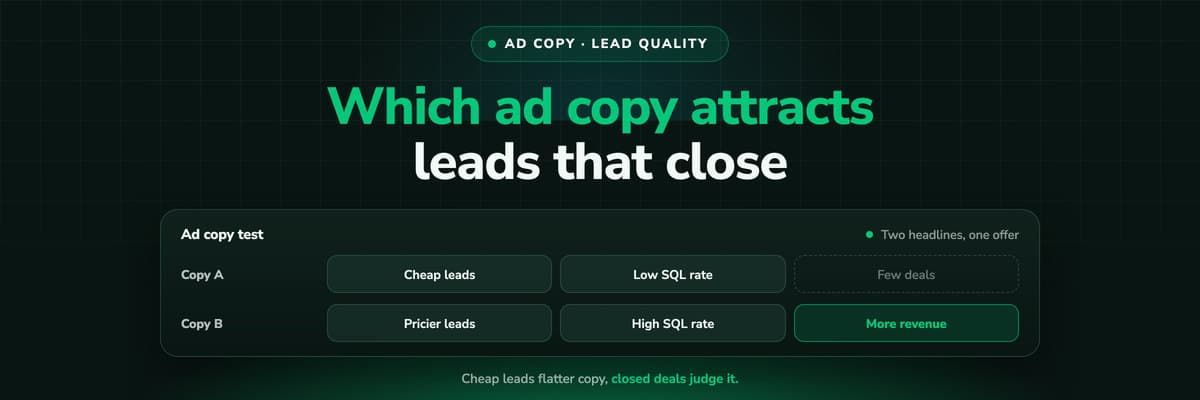
Every copy test in Ads Manager has a winner by Friday: the version with the cheapest cost per lead. Sales sees the other side of it a few weeks later, when the cheap leads turn out to be students, competitors and people who expected the product to be free.
Wording decides who raises their hand, not only how many. This guide measures that properly: qualification rate and close rate per ad from your CRM stages, a test design that isolates the words, the sample size arithmetic that keeps you from reading noise, and wording patterns to test, offered as hypotheses rather than rules.
Quick Summary: Ad Copy and Lead Quality
In short
Judge ad copy on what its leads become, not on how many it gets. For each ad, take the leads it produced, the share your team qualified (qualification rate) and the share of qualified leads that closed (close rate), from the stages in your CRM. Test one wording change at a time against the same audience and budget, decide the metric and the run length before launch, and read qualification rate first, because there are far more leads than deals. A handful of deals per version is noise: with 25 qualified leads and 5 deals, the true close rate could plausibly be anywhere from about 4% to 36%.
Below: the two rates, getting stages per ad, wording hypotheses, the test design, the arithmetic, and how to read the result.
Why Cost per Lead Is the Wrong Scoreboard for Copy
Cost per lead rewards copy that removes doubt, and doubt is often what filters out the wrong people. "Free guide, no strings attached" converts well because it asks for nothing. "For B2B teams spending over $20k a month on ads" converts worse because most readers are not that team, which is exactly what you want them to learn before they fill the form.
Example: two versions of one ad, same audience and spend (all figures are examples)
| Version A: broad | Version B: qualifying | |
|---|---|---|
| Spend | $5,000 | $5,000 |
| Leads | 200 | 100 |
| CPL | $25 | $50 |
| Qualified | 30 | 35 |
| Qualification rate | 15% | 35% |
| Cost per qualified lead | $166.67 | $142.86 |
Ads Manager calls A the winner at half the CPL. The CRM says B delivers more qualified leads for the same money, and sales spent their week on 100 conversations instead of 200. More on why the platform's number drifts from yours in the true cost per lead.
The Two Rates That Measure Lead Quality per Ad
Version B above: 35 ÷ 100 = 35%.
Example: 7 won from 35 qualified = 20%.
Qualification rate is fast: your team decides within days, and the counts are large. Close rate is slow and small, but it is where the money is, and copy that over-promises can qualify well and close badly. Track both, plus cost per qualified lead and revenue per ad, which fold spend back in. What "qualified" means is your definition, set once; see qualified lead.
Getting CRM Stages per Ad
None of this works unless every lead in the CRM knows which ad it came from, and its stage is kept up to date. Three things have to be in place before the first copy test.
- The ad on the lead. Either the ad id in a UTM parameter carried into a hidden form field, or the click id (fbclid, gclid, li_fat_id and the others) kept with the visitor and resolved to the ad. The click id survives a return visit; a URL parameter often does not. See click id.
- Stages that mean the same thing for every rep. A written rule for qualified, and the closed-won stage used consistently. A stage one rep sets on the first call and another after the third makes the qualification rate a measure of the rep.
- One place where both meet. Spend per ad from the platform and stages per ad from the CRM, joined by the ad. A spreadsheet works for one test; it does not survive ten.
Wording Patterns Worth Testing (Hypotheses, Not Rules)
No study we can cite tells you which wording brings better leads in your market, and a pattern that works for one offer fails for the next. These are hypotheses worth a test, each with the trade it probably makes. Your CRM decides.
- Name the buyerCalling out a role or company type in the first line ("For agency owners...") may cut volume and raise qualification rate, because the wrong readers self-select out.
- Mention the price or a minimum"From $X a month" or "for teams over N people" may cost leads and save sales calls. Watch close rate: price-aware leads may close faster.
- State the real next step"Book a 30-minute demo" sets a higher bar than "Learn more". Fewer leads, possibly more serious ones. The button is part of the copy.
- A specific problem over a general benefit"Your CRM says Direct for 40% of deals" versus "Better attribution". Specific pain may attract the people who have it.
- Proof that matches the buyerA named customer like the reader may qualify better than a big number with no context. Test the proof type, not only the wording.
- Remove the baitWords like "free", "instant" and "no commitment" may raise volume and lower qualification rate. Worth testing by taking them out.
The figures inside these examples (the 40%, the $X, the N people) are placeholders. Use your own, and only claims you can back. To find which patterns your past ads already used, tag them with the template in AI ad creative analysis.
Designing a Copy Test That Can Answer
- One change per testChange the hook, or the ask, or the qualifier, not all three. Otherwise a result cannot tell you which change did it.
- Same audience, same budgetMeta's A/B test feature (a tool group in its ads MCP server too) is built for this. Two ads in one ad set are quicker to set up, but delivery decides how much each gets, so spend rarely splits evenly. Compare rates, not totals, either way.
- The metric decided up frontQualification rate as the main read, close rate and cost per qualified lead as checks. Write it down before launch.
- A run length tied to your cycleStop spending when each version has the leads you planned, then wait until your typical time to qualify (and later, to close) has passed before reading.
- Hands off while it runsNo budget shifts, no audience edits. Each change starts a new test inside the old one.
Optimising on the qualified stage changes the test
If you send the qualified stage back to Meta or Google and optimise on it, the platform will find different people for each version. That is fine, it is what you want in production, but then the test compares copy plus delivery. Keep the optimisation event the same for both versions. Setup in how to send CRM data back to Meta and Google.
Why Five Deals Is Noise: The Arithmetic
There is no magic number of deals, and we will not invent one. What we can do is show the arithmetic, so you can run it on your own counts. It uses the standard error of a proportion, √(p × (1 − p) ÷ n), and the rough 95% range of p ± 2 standard errors. With small counts this approximation is crude, which only strengthens the point.
Example: two versions, 25 qualified leads each (all figures are examples)
| Version A | Version B | |
|---|---|---|
| Qualified leads | 25 | 25 |
| Won deals | 5 | 3 |
| Close rate | 20% | 12% |
| Standard error | √(0.20 × 0.80 ÷ 25) = 8 points | √(0.12 × 0.88 ÷ 25) ≈ 6.5 points |
| Rough 95% range | about 4% to 36% | about 0% to 25% |
The ranges overlap almost entirely. Version A looks two thirds better, and the data cannot tell you whether it is better at all. Seen as counts: a count of 5 has a natural spread of about √5 ≈ 2.2, so a version that "really" closes 5 in 25 will often show 3 or 7 by chance alone.
How many it would take
To see a gap of 8 points (20% against 12%) at about two standard errors, the standard error of the difference, √((0.20 × 0.80 + 0.12 × 0.88) ÷ n) = √(0.2656 ÷ n), has to fall to 4 points. That gives n ≈ 0.2656 ÷ 0.0016 ≈ 166 qualified leads per version, or roughly 33 and 20 deals. And that is only the level where the gap stops looking like chance; it is not a guarantee that a real gap will show.
The same arithmetic on qualification rate is kinder, because leads are plentiful. With 200 leads per version qualifying at 25% and 15%, the standard error of the difference is √((0.1875 + 0.1275) ÷ 200) ≈ 4 points, and the 10 point gap is about 2.5 standard errors. That is why qualification rate is the main read and close rate the check.
Reading the Result
What a copy test usually shows, and what to do next
| What you see | What it likely means | What to do |
|---|---|---|
| Higher CPL, higher qualification rate, lower cost per qualified | The copy filters the right way | Keep it, and test the next variable |
| Lower CPL, lower qualification rate | The copy attracts curiosity | Judge on cost per qualified lead before scaling |
| Qualification up, close rate down | The copy over-promises | Check what sales hears on the first call; align the promise |
| No difference beyond the noise | The change did not matter much | Keep the cheaper version, test a bigger change |
| One version wins on a few deals | Not yet a result | Run on, or read qualification rate instead |
Running the Read With Claude
An AI client with two connectors does the joining in a chat. The Meta ads MCP server reports spend and results per ad, and its tool groups include A/B tests; the LeadJourney MCP server answers with leads, qualified leads, won deals and revenue per ad from the CRM. Prompts that work:
- "For the two ads in this test, give me spend, leads, qualified leads and won deals since launch, with qualification rate, close rate and cost per qualified lead."
- "Compute the standard error for each rate and say whether the gap is larger than two standard errors."
- "Quote the first line and the button of each ad next to its qualification rate."
- "Across the last 90 days, which ads have the highest qualification rate with at least 50 leads? What do their first lines have in common?"
Claude proposes; you decide. Writing a new version or pausing the loser goes through the Meta connector, where new ads land paused, or through Ads Manager. More in Meta Ads MCP plus your CRM and Claude for Meta Ads.
Where LeadJourney Fits
LeadJourney does not write or test ad copy and does not change your ads. It makes the per ad lead quality readable. One script, live in about 21 minutes, tracks every click, form fill and call server-side and first-party at 95%+ accuracy, keeps the click ids and joins each lead to its CRM deal in HubSpot, Salesforce, Pipedrive, Close, Attio, GoHighLevel, ActiveCampaign, Odoo, Zoho CRM or Microsoft Dynamics 365, with the stage it reaches.
So every campaign, ad set and ad on Meta, Google, LinkedIn, Microsoft, Reddit, X, Taboola and Outbrain shows leads, qualified leads, won deals and revenue beside its spend. The stages you map go back to the platforms as conversions, and the MCP server lets Claude or ChatGPT read the same numbers. It reads; it never edits an ad or a CRM record.
Further Reading
- AI ad creative analysis: hook, body and close, judged on revenue
- Automated budget rules on cost per qualified lead
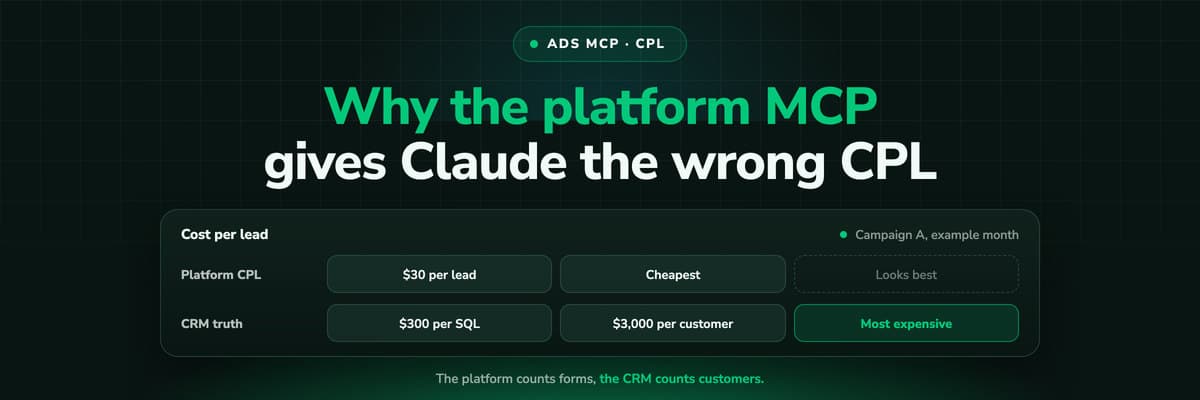
- Why your ad platform's MCP gives Claude the wrong CPL
- Meta Ads MCP plus your CRM: which campaigns made revenue
- Claude for Meta Ads: connector, skills and 25 prompts
- How to increase the quality of your leads in performance marketing
- Fix Meta Ads lead quality
- Lead quality per channel and campaign
In the glossary
FAQ
Frequently Asked Questions
What marketers ask when cheap leads stop turning into customers.
Which ad copy gets better quality leads?
There is no universal answer. Copy that names the buyer, states the real next step or mentions a price or minimum often trades volume for quality, but only your CRM can show it for your offer. Test one change at a time and read qualification rate per ad.
How do I measure lead quality per ad?
Put the ad on every lead, through a UTM parameter or the click id joined to the CRM, then divide qualified leads by leads (qualification rate) and won deals by qualified leads (close rate) for each ad.
How many leads do I need for an ad copy test?
Work it out from the gap you want to see. With 200 leads per version, a 25% against 15% qualification rate is about 2.5 standard errors apart. Telling a 20% from a 12% close rate needs roughly 166 qualified leads per version.
Is a lower cost per lead always better?
No. Copy that removes all friction often lowers CPL and qualification rate together. Compare cost per qualified lead, which is spend divided by the leads your team qualified.
Can Claude tell me which ad copy brings better leads?
Only with CRM data. A platform connector alone gives Claude clicks and form fills. Add a connector that reads qualified leads and won deals per ad, and Claude can compute the rates and check whether a gap is larger than the noise.
Keep reading
More from the blog
 B2B Marketing Attribution
Why Your Ad Platform's MCP Gives Claude the Wrong CPL
Connect Claude to Meta or Google Ads through MCP and ask which campaign is cheapest per lead: it will answer correctly, by the platform's count. A worked example of why that campaign can be the most expensive per customer, what the platform's conversion column actually counts, and how to give Claude the CRM side.Read the article12 min read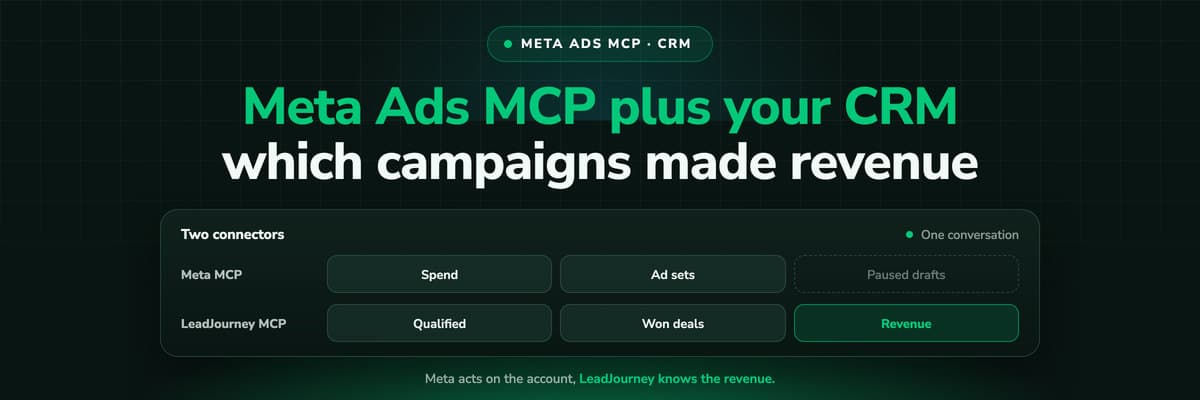 B2B Marketing Attribution
Meta Ads MCP Plus Your CRM: Which Campaigns Made Revenue
Meta's MCP server can read and draft campaigns, but it cannot see which leads closed. Put LeadJourney's MCP server in the same Claude conversation and every question can be asked on closed revenue. A worked example, the workflow step by step, and the guardrails that keep a person in charge of every change.Read the article12 min read B2B Marketing Attribution
Are X Ads Worth It? Measuring X Ads ROI on Revenue
Whether X Ads are worth it depends on what you measure and on what you sell. How to calculate X Ads ROI and ROAS on closed revenue, what X's own conversion numbers include (a like a month before the purchase counts by default), what a fair test needs, and the traps that make X look better or worse than it is.Read the article16 min read
Lead quality
Ready to see which ads bring leads that close?
LeadJourney joins every ad click to the CRM deal and shows qualification rate, won deals and revenue per campaign, ad set and ad. Live in about 21 minutes, 14-day free trial.