















BlogB2B Marketing Attribution
Dynamics 365 Customer Insights Attribution: What It Actually Measures
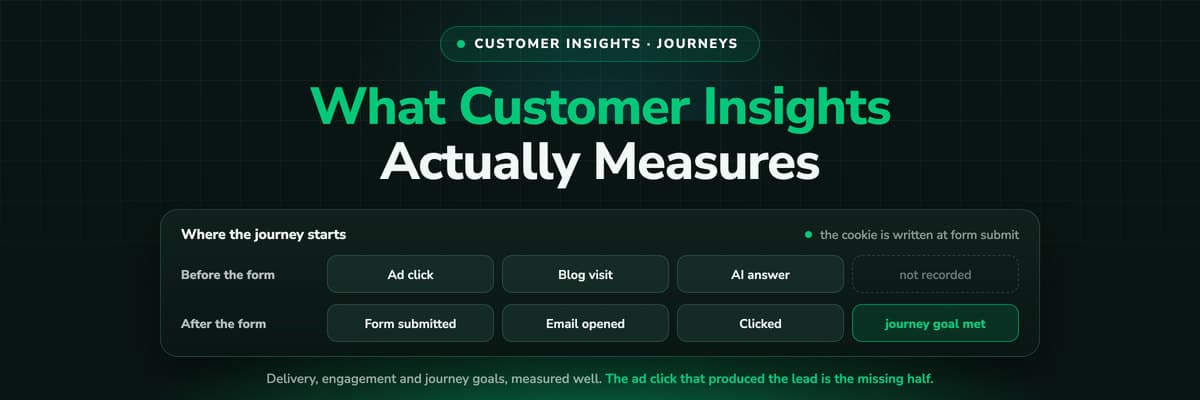
Customer Insights - Journeys measures delivery, engagement and journey goals: opens, clicks, form submissions and where people fell out of a journey. What it does not measure is the ad click that produced the lead. The rename explained, the analytics listed, and the gap named.

Contents
Summarise this article with AI
Opens the page with a ready prompt in:


Nothing is sent until you pick a service.
Ask two people in the same company what Dynamics 365 Customer Insights is and you will get two answers, because since September 2023 it has been two products under one name. Ask what it attributes and the answers get vaguer still, because its analytics are excellent at one thing and silent about another, and the boundary between them is not where most people assume.
This is what Customer Insights measures, in Microsoft's own terms, what the two halves of it are for, and where marketing attribution in Dynamics 365 actually stops. No feature list, and no claim that the product is worse than it is: the analytics are good. They are analytics of your own marketing execution, not of the channels that produced your customers.
Quick Summary: Attribution in Dynamics 365 Customer Insights
In short
Customer Insights - Journeys analytics measure delivery, engagement and journey goal attainment: sends, opens, clicks, form submissions, where people left a journey, and whether a journey met its goal. Its web tracking identifies a person when they submit a form. What none of it records is the ad click, the search or the AI answer that brought the person to the form in the first place, and no ad spend enters the product at all. So you can prove an email worked and still not know which campaign produced the pipeline.
What follows is the rename in one section, the analytics in Microsoft's own categories, the four limits worth knowing before you build a report on them, and the two honest ways to close the gap.
Journeys and Data: What the 2023 Rename Actually Did
On 1 September 2023 Microsoft brought two products together under one name, and the confusion has outlived the announcement. Nothing was merged in the sense of one app replacing another. Two apps got new names and one label over the top of both.
- Customer Insights - JourneysWhat used to be Dynamics 365 Marketing. Real-time journeys, marketing emails, text and push, forms, events and lead scoring. If somebody in your company says they build the campaigns in Customer Insights, this is what they mean.
- Customer Insights - DataWhat used to be Dynamics 365 Customer Insights on its own: the customer data platform. It unifies records from several systems into one profile and builds segments and measures on top of them.
- Dynamics 365 SalesNeither of those. Leads, contacts, accounts and opportunities in Dataverse, and the licence most sales teams actually have. It carries no marketing analytics of its own.
Why this matters for a reporting question
Most attribution arguments in a Dynamics organisation are really a licensing question in disguise. The interactions live in Journeys, the revenue lives in Sales, and joining them is a report somebody has to build. If your company has Sales but not Journeys, which is common, there are no marketing interactions in the system at all.
What Customer Insights - Journeys Analytics Measure
Microsoft groups the analytics into a handful of views, and the grouping tells you what the product is for: measuring delivery, engagement and journey goal attainment, so you can fine-tune journeys, channels and content.
Contact and lead insights
Everything one person did with your marketing: emails sent, opened and clicked, push, text and custom channel interactions, plus website and form insights showing which forms they visited and submitted, with the content of each submission.
Journey operational analytics
A Sankey view of the journey with the width of each path in proportion to the people on it, plus step analytics: inflow, processing, processed, exit and the reasons, and goal attainment where a goal is set.
Channel analytics
Per message: delivery rate, open rate, click rate and, for text, response rate, with delivery funnel details down to email clients, device types, operating systems and browsers.
Aggregate dashboards
Cross-journey and cross-channel dashboards that roll the above up across all your journey orchestrations, for the monthly review rather than the single campaign.
Read that list back and the shape is clear. Every metric is about a message you sent or a journey you built. It is a good set of marketing execution analytics, and for judging an email programme or a nurture journey it is the right tool.
Where the Web Tracking Starts, and Why That Is the Whole Story
Customer Insights - Journeys does track website behaviour, which is why teams reasonably expect it to answer source questions. The detail that decides everything is when the identity begins.
Its web tracking writes a cookie carrying the form submission id at the moment a form is submitted. Form capture, which connects a third-party form, maps each field to a Dataverse column at the same moment. So the person becomes known at the form, and the journey the product can show you starts there. The ad click three weeks earlier, the two blog visits, the return on a brand search and the comparison read in an AI assistant all happened before the system had anybody to attach them to.
This is not unusual, and it is not a flaw
Marketing automation platforms are generally identity-first: they exist to talk to people they know. Attribution is the opposite problem, because the touches that matter most happen while the visitor is still anonymous. Expecting one tool to be excellent at both is where most Dynamics attribution projects go wrong.
Four Limits Worth Knowing Before You Build a Report
- No ad spend enters the product. There is no connection to Microsoft Advertising, Google Ads, Meta or LinkedIn, so no cost per lead, no ROAS and no cost per won opportunity can be calculated inside Customer Insights.
- No cross-channel attribution model. The documented analytics are delivery, engagement and goal attainment. Distributing credit for one opportunity across a LinkedIn ad, an organic visit and a brand search is not one of the built-in views; that is a model you build in Power BI or Microsoft Fabric, on data that has to include the clicks in the first place.
- The built-in views show 12 months. Contact and lead insights, journey and channel analytics display interaction data for the last twelve months, and separately, Dataverse entities carry a two-year retention policy. A B2B cycle that runs past those boundaries needs its history somewhere else.
- Exports are capped. Interaction data exports at 10,000 records, journey step exports at 50,000. Fine for a diagnosis, awkward as the foundation of a monthly reporting pipeline.
None of these are secrets. All four are in Microsoft's own documentation, and every one of them is a reason teams end up building the real report in Fabric or buying something that measures the click side.
After the Outbound Marketing Removal
If your marketing reporting broke sometime in 2026, this is probably why. The outbound marketing module was removed from every Customer Insights - Journeys environment in May 2026, after two and a half years of notice.
- The analytics data was merged into the real-time journeys data, which is a different format in a different place.
- The insights reports that lived in the outbound interface are gone, and are not coming back.
- Existing Power BI custom reports built on outbound data do not work against the consolidated data, so they have to be rebuilt.
- Microsoft's answer for custom reporting is Fabric, against the Customer Insights - Journeys interaction schema, where a SourceSystem attribute tells you which module produced each interaction.
- Marketing lists survived, because they are a Sales entity, and can still be used inside real-time journeys.
If you are rebuilding anyway, it is worth asking what you want the new report to answer. Rebuilding an engagement dashboard in Fabric gets you back to where you were. The question most teams actually have, which campaign produced the revenue, needs a data source that none of these projects adds: the sessions before the form.
Two Ways to Close the Gap
Building it in Fabric, or measuring the click side directly
| Approach | What it gives you | What it asks for |
|---|---|---|
| Fabric plus a web analytics source | Journeys interactions, Dataverse pipeline and whatever web data you can supply, joined in one lakehouse and modelled however you like | A data engineer, a modelling decision nobody in marketing will own, and a web data source that still has to identify the anonymous visit |
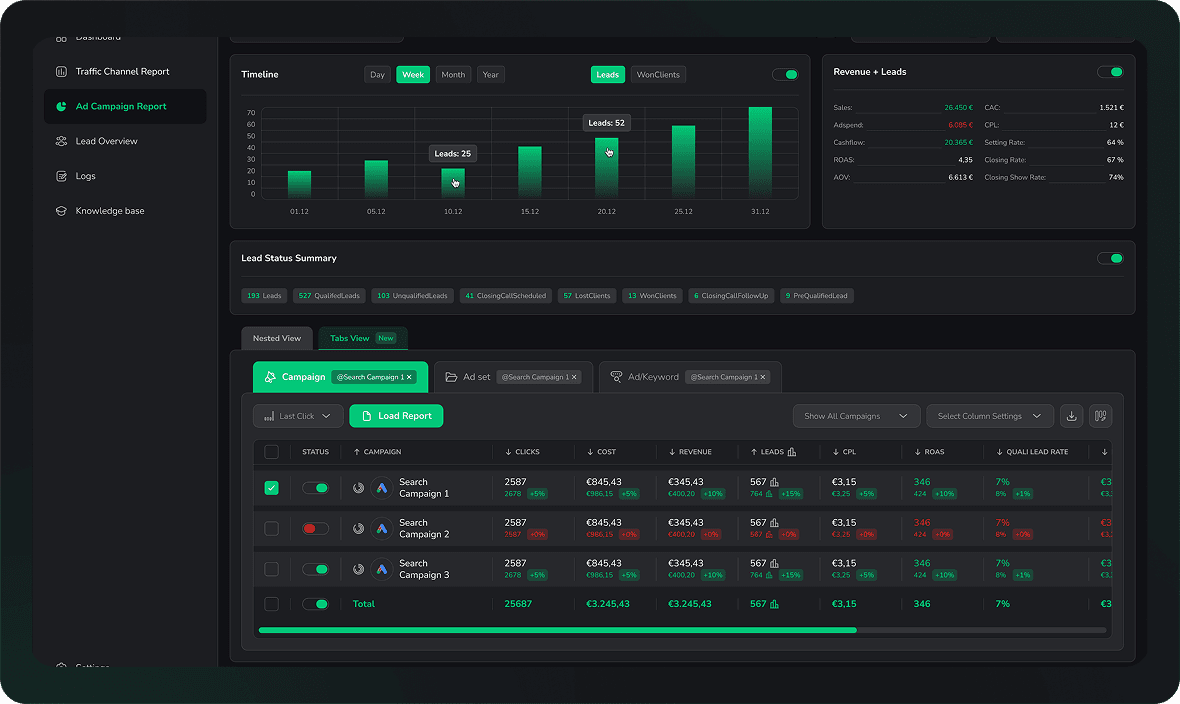
| First-party tracking writing into Dataverse | The channel, campaign, ad and click ID observed at the first visit and written onto the Lead and the Opportunity, with ad spend joined and won revenue sent back to the platforms | A platform subscription, a script on the website, and the discipline to report on the observed columns |
They are not mutually exclusive: several teams run Journeys for execution, keep Fabric for the warehouse and use a tracking platform for the source columns. What does not work is expecting any single one of the three to answer all of it.
How LeadJourney Fills the Half That Is Missing
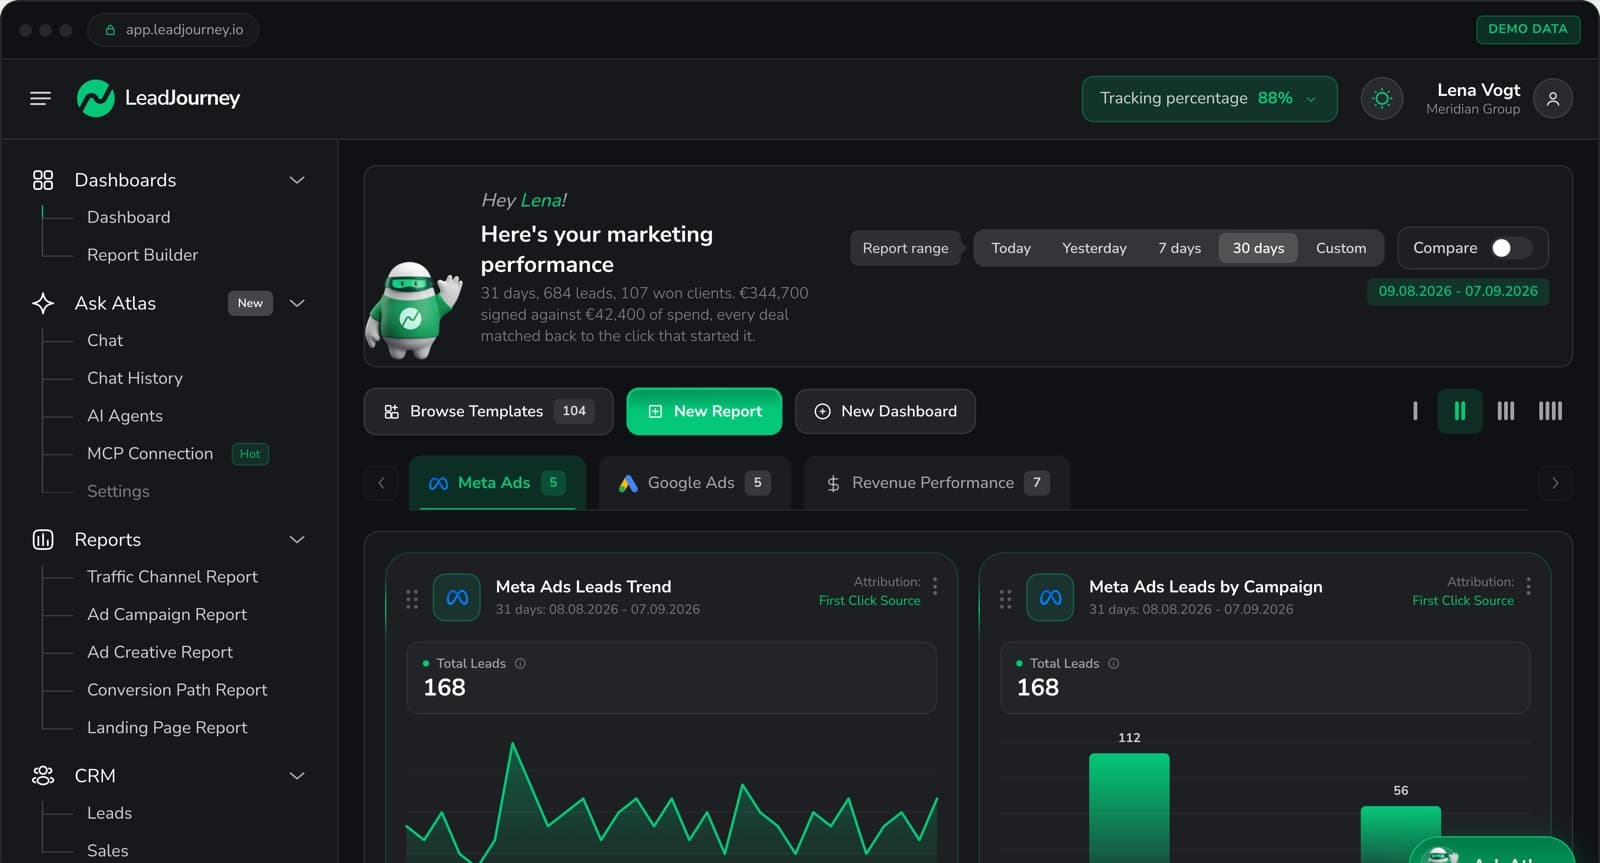
LeadJourney records the part that happens before anybody is known. One script on your site or in your GTM container, live in about 21 minutes, tracking every visit server-side on your own domain at 95%+ accuracy. At the first click it captures msclkid, gclid with gbraid and wbraid, fbclid and li_fat_id, the UTMs and the landing page, and holds them first-party until the visitor identifies themselves.
The Microsoft Dynamics integration writes that journey into Dataverse as columns on the Lead, the Account and the Opportunity, and reads stages and revenue back over a webhook. Spend comes from Microsoft, Google, Meta and LinkedIn Ads, so cost per won opportunity is measured rather than estimated, and every attribution model, first click, last click, linear, time decay and position based, runs on the same tracked events without re-tracking anything.
It is not a replacement for Customer Insights - Journeys, and it does not try to be. Journeys keeps the emails, the journeys, the forms and the lead scoring. LeadJourney answers which ad, channel and campaign produced the record that entered them, and sends the won opportunity back to the platform that earned it.
Further Reading
Keep going with Dynamics 365 lead source tracking, what campaign management really tracks and the attribution tools built for Dynamics. For the wider picture, see B2B marketing attribution and the multi-touch attribution models behind it, plus the Microsoft Dynamics integration.
In the glossary
FAQ
Frequently Asked Questions
The questions Dynamics marketers ask about Customer Insights and attribution.
Is Dynamics 365 Marketing the same as Customer Insights?
It is the same application under a new name. On 1 September 2023 Dynamics 365 Marketing became Customer Insights - Journeys, and the product that had been called Customer Insights became Customer Insights - Data. Journeys is the marketing application: real-time journeys, emails, forms, events and lead scoring. Data is the customer data platform that unifies profiles and builds segments. They are sold under one Customer Insights name and used by different people.
Does Dynamics 365 Customer Insights do multi-touch attribution?
Its documented analytics measure delivery, engagement and journey goal attainment: sends, opens, clicks, form submissions, journey step flow and goal completion, plus aggregate cross-journey and channel dashboards. Distributing credit for one opportunity across several marketing channels is not one of those built-in views. You can build a model on top of the interaction data in Power BI or Microsoft Fabric, but the model is only as good as the touchpoints underneath it, and the ad clicks before the form are not among them.
Does Customer Insights track website visitors before they fill in a form?
Its web tracking writes a cookie carrying the form submission id when a form is submitted, so the identity begins at the form. Pages a known contact visits afterwards show up in their website and form insights. The anonymous sessions before that first submission, which is where the ad click, the organic search and the AI answer live, are not attached to anybody, so they cannot be reported on later.
How far back do Customer Insights analytics go?
Contact and lead insights, journey analytics and channel analytics display interaction data for the last 12 months, while the historical data itself is retained in storage. Separately, Dataverse entities carry a two-year retention policy from their creation date, which can affect analytics views built on Dataverse interaction data. For a sales cycle measured in quarters, plan where the longer history is going to live.
What happened to outbound marketing and its reports?
Outbound marketing was removed from every environment in May 2026. Its analytics data was merged into the real-time journeys data, the insights reports that were part of its interface are no longer available, and existing Power BI custom reports built on outbound data do not work against the consolidated data because the format, location and access method all changed. Microsoft's route for custom reporting now is the Microsoft Fabric integration.
Can I see ad spend or ROAS in Customer Insights?
No. There is no connection between Customer Insights and your ad accounts, so cost per lead, ROAS and cost per won opportunity cannot be calculated inside it. Those need the spend from Microsoft Advertising, Google Ads, Meta and LinkedIn joined to the pipeline, which is a job for a tool that reads both sides.
Keep reading
More from the blog
 B2B Marketing Attribution
SAP Attribution: What Sales Cloud Records, and What It Never Sees
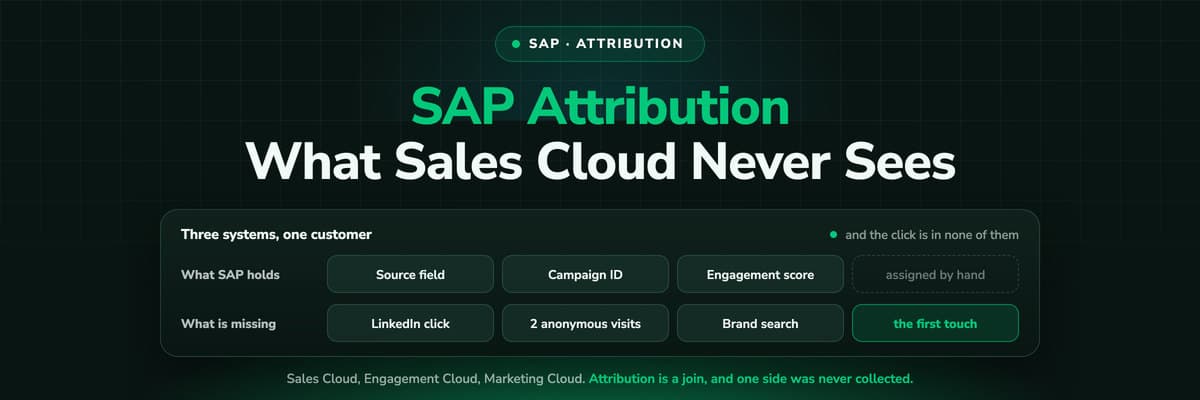
SAP splits the customer into three systems and the ad click lives in none of them. What the Source field on a lead actually records, what engagement scores measure, what the Marketing Cloud sunset changes, and how to get the campaign behind the revenue onto the record.Read the article11 min read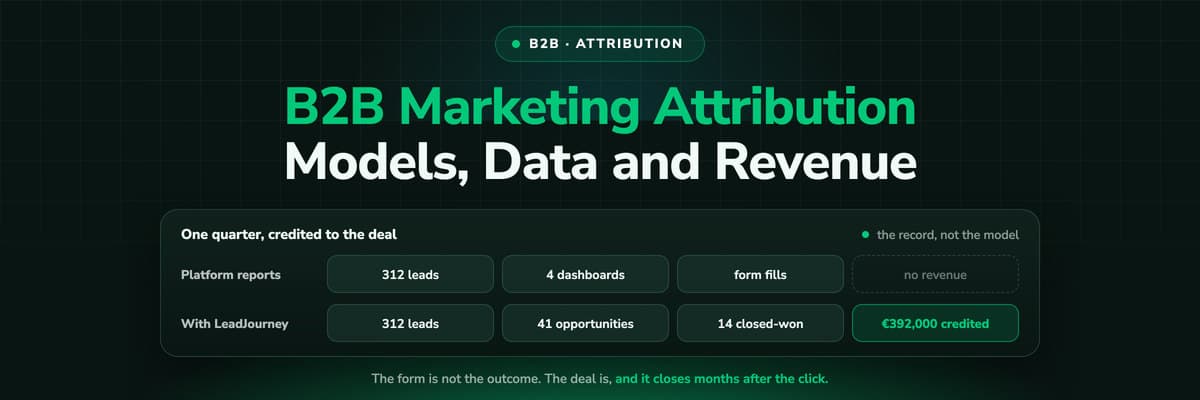 B2B Marketing Attribution
B2B Marketing Attribution: Models, Data and Revenue (2026)
A B2B deal closes months after the click, is bought by a committee and is recorded in the CRM rather than in any ad platform. This guide covers the whole discipline: what B2B marketing, revenue and sales attribution each credit, lead-level against account-level architecture, pipeline stages as conversions, what your CRM does on its own, build or buy, and a seven step implementation.Read the article22 min read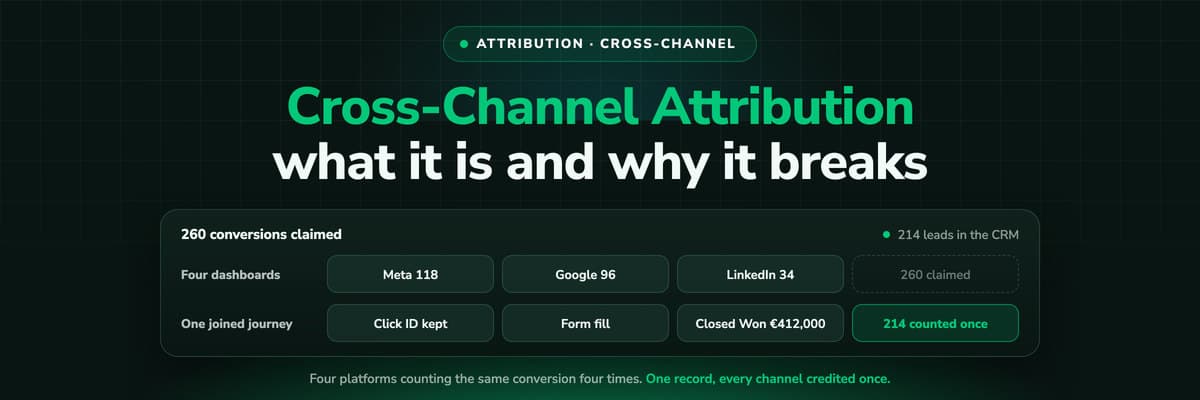 B2B Marketing Attribution
Cross-Channel Attribution: What It Is and Why It Breaks
Meta claims 118 conversions, Google claims 96, LinkedIn 34 and Microsoft 12. The CRM has 214 leads. Cross-channel attribution is the work of turning four honest, incompatible answers into one, and this guide covers the four methods that try it, what each of them can and cannot see, and the setup that decides whether any of them holds.Read the article14 min read
The anonymous half
Ready to see what happened before the form?
LeadJourney tracks every visit server-side before anybody is known, joins the first click to the person when they convert, writes the journey onto your Dynamics records and sends won revenue back to the ad platforms. Live in 21 minutes, 14-day free trial.