











Tax and accounting
54% better lead quality after using LeadJourney for marketing
Karsten Guhr
Managing Director
Read the story
Databox alternative
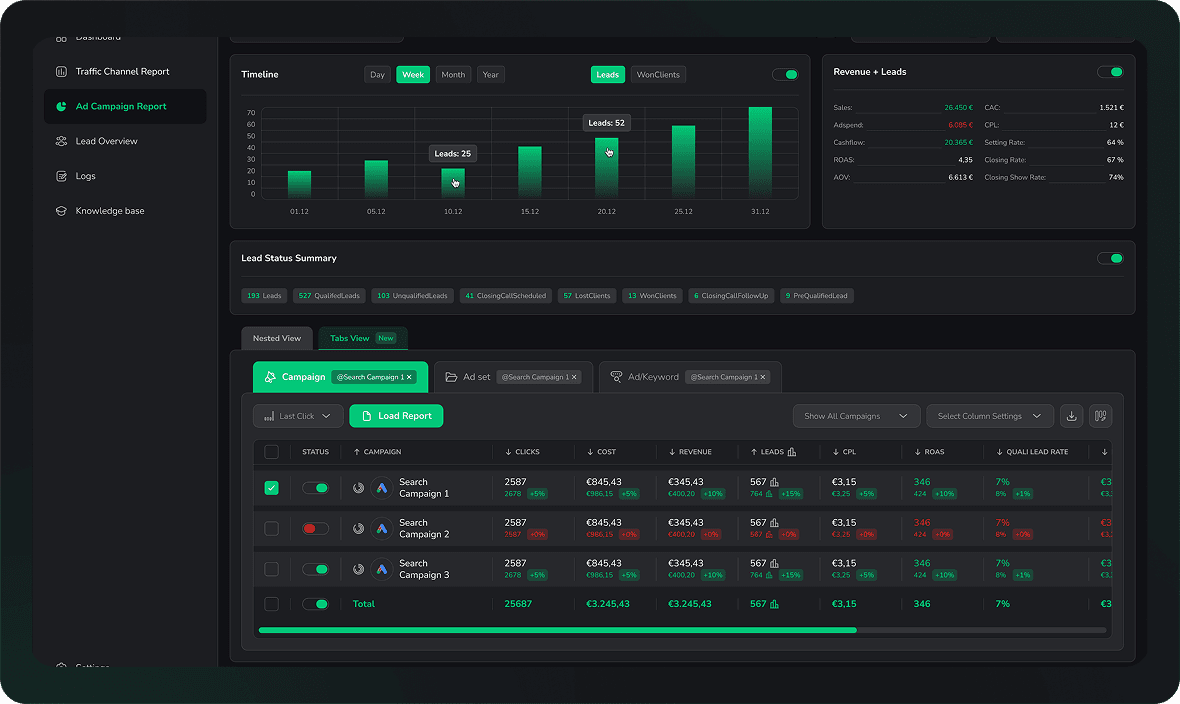
Databox puts the numbers your tools report on one scorecard. LeadJourney produces the number none of them report: which campaign made the deal.
Rated by the teams who switched
Trusted by 100+ lead generation businesses, agencies and affiliates






LeadJourney vs Databox
Databox displays what your tools report; LeadJourney creates, attributes and explains the number they cannot. The rows are the features our pricing page lists, so the table shows where a dashboard stops.
| Capability | Databox | LeadJourney |
|---|---|---|
| Built for | DataboxTeams that want every KPI from every department on one dashboard: SaaS companies, agencies, consultants and functional leaders. | LeadJourneyLead generation first, B2B and B2C: forms, calls, CRM stages and closed deals are the conversion model, plus e-commerce through the Shopify integration or a manually connected shop, for advertisers, agencies and affiliates. |
| Collects data | DataboxNo. It connects to sources that already have the data; one account or property is one source, 3 to 30 included by plan. | LeadJourneyYes. First-party tracking on your own domain, server-side, 95%+ of conversions captured, plus static and dynamic call tracking numbers as an add-on. |
| Sources | Databox130+ cloud integrations, spreadsheets, SQL and NoSQL databases, and a REST API to push anything else in. | LeadJourneyMeta, Google, LinkedIn, Microsoft, Reddit, X, Taboola and Outbrain Ads, the organic and AI sources, HubSpot, Salesforce, Pipedrive, Close, Attio, GoHighLevel, ActiveCampaign, Odoo, Zoho CRM and Microsoft Dynamics 365, calls through the call tracking add-on or CallRail and Podium, and custom channels by webhook. Fewer, joined per lead. |
| Attribution models | DataboxNot documented on the pricing page; each connected source reports its conversions on its own model, and the dashboard shows them side by side. | LeadJourneyEvery rule-based model on every plan, on the click stream and the CRM, switchable without re-tracking; custom models on Enterprise. |
| CRM and pipeline | DataboxHubSpot, Salesforce and Pipedrive CRM as sources, so pipeline and deal metrics sit on the dashboard; joining a deal to the click that started it is not a feature the pricing page lists. | LeadJourneyStages, deal values and closed revenue joined to the journey per lead, with attribution written back into the CRM. |
| Revenue back to the ad platforms | DataboxNot on the feature list; Databox reads from the ad platforms, nothing on the pricing page sends conversions back to them. | LeadJourneyServer-side conversion sync to Meta, Google, LinkedIn, Microsoft, Reddit, X, Taboola and Outbrain Ads on every plan; stage changes and closed deals arrive as offline conversions. |
| Organic and AI search sources | DataboxOnly as well as the analytics source classifies them; an AI engine arrives the way GA4 files it. | LeadJourneyGoogle, Bing, YouTube, LinkedIn and the AI engines (ChatGPT, Gemini, Claude, Copilot, Perplexity, Grok and DeepSeek) as distinct sources, out of the box. |
| Lead-level view | DataboxMetrics, not records: dashboards aggregate what a source reports; datasets prepare tables of raw data inside Databox. | LeadJourneyThe full journey of every named lead, from the first click to the closed deal, with the CRM stage on it. |
| Reports | DataboxUnlimited dashboards and reports from Analyst up, templates and pre-built metrics, goals and forecasting, scorecards and digests to Slack, email and a TV screen. | LeadJourneyChannel, campaign, landing page and conversion path reports built in, a custom report builder, saved dashboards; the warehouse export streams the raw data into BigQuery, which Looker Studio, Power BI and Tableau read natively. |
| AI analyst | DataboxGenie answers questions and writes performance summaries on the connected metrics, on 50 to 1,000 AI credits a month by plan. | LeadJourneyAtlas answers questions in plain language; Atlas agents watch the data and send scheduled reports to email, Slack or WhatsApp. |
| MCP, API and export | DataboxMCP server and REST API from Analyst up; CSV export of datasets from Team. | LeadJourneyMCP connection for Claude, ChatGPT and Cursor from Growth (an add-on below it), API from Growth, the Zapier app on every plan; from Scale, the warehouse export streams clicks, conversions and leads into your own BigQuery dataset, which Looker Studio, Power BI and Tableau read natively, Snowflake on the roadmap. |
| Data hosting and compliance | DataboxGDPR compliant and SOC 2 certified, as the pricing page states; the data region is not published there. | LeadJourneyFrankfurt, Germany. First-party tracking on your domain, Art. 28 GDPR DPA on request, two-factor authentication. |
| Setup | DataboxSources connect in minutes; every metric a source does not report is a dataset or a custom metric you build and maintain. | LeadJourneySelf-serve, live in 21 minutes with the reports filled; onboarding call with a tracking expert from Starter. |
| Pricing | DataboxPublic: Free, then Analyst $71, Team Core $199, Team Scale $319 and Agency from $79 a month billed annually ($89, $249, $399 and $99 monthly), client packs $20 each, Custom on quote. | LeadJourneyPublic tiers by marketing spend: from €129 a month, monthly or yearly, attribution included, after a 14-day free trial. |
Databox is a good KPI layer: 130+ integrations, up to 10 users on Team Scale and unlimited on Agency, and scorecards a leadership team actually opens. A company that wants finance, product and marketing on one screen should look at it seriously. The table is about one column on that scorecard: the marketing KPI no connected source can supply, because nothing in the stack knows which click made the deal.
Pricing
Databox prices by data sources, users and clients, LeadJourney by marketing spend. Both ladders below are the published tiers.
DataboxPriced by data sources, users and clients, billed annually
US dollars as published on databox.com, billed annually; monthly billing is $89, $249, $399 and from $99. Each plan includes a fixed number of data sources, one GA4 property or one ad account is one source, and more sources means a higher plan; on Agency each client pack adds 1 client and 5 sources for $20 a month ($25 monthly). White-labelling ($80), advanced security ($40), OKRs ($14) and AI credit top-ups ($200) are add-ons. 14-day trial of any paid plan, no card. Re-read 13 September 2026.
Priced by marketing spend per month
Advertiser plans in euros, monthly billing; yearly billing saves 20%. Every plan starts with a 14-day free trial, no credit card. Agencies and affiliates have plans of their own.
See the full pricingData sources price the plumbing; marketing spend prices what is at stake. A team spending €20,000 a month on six sources sits on LeadJourney's €499 Growth plan, everything included. On Databox the same six sources need Team Core at $199 a month billed annually, for a dashboard of the numbers those tools already report.
Why teams switch
Three arguments come up in almost every evaluation. Each one is a set of concrete capabilities, not a slogan.
Conversions are recorded on your own domain and sent server to server, so ad blockers, iOS and declined consent lose far less of them. 95%+ of conversions captured.
Real conversions and revenue go back to Meta, Google, LinkedIn, Microsoft, Reddit, X, Taboola and Outbrain Ads server-side, so their algorithms optimise on deals that actually closed.
Google, Bing, YouTube, LinkedIn, email, referrals and the AI engines (ChatGPT, Gemini, Claude, Copilot, Perplexity, Grok and DeepSeek) attributed next to your ads at no extra cost.
Static numbers per campaign or dynamic number insertion per visitor, on every plan, from €50 a month with five numbers and 250 minutes included, and CallRail or Podium if you already run one. Every call lands on the click that made the phone ring.
Every conversion type a lead gen business has, tracked out of the box, with the CRM stage as the signal that matters rather than a checkout event.
First click, last click, linear, position based and the rest on every plan, switchable without re-tracking anything; custom models on Enterprise.
Closed revenue from your CRM matched to the campaign, ad and keyword that created it, so return on ad spend is measured on deals, not on lead counts.
Calls, meetings and signed contracts connected back to the exact ad that generated them, and sent to the ad platforms as the conversion they should optimise on.
See which channels bring leads that qualify and close, not just the ones that fill the form.
Every touchpoint from the first click to the closed deal on one timeline, with the CRM stage on it, for any single lead your sales team asks about.
Channel, campaign, landing page and conversion path reports, plus the lead overview, built in and filled the moment data arrives.
Build any report from raw data, pick the metrics, dimensions and layout, then save it as a live dashboard. No SQL required.
Atlas reads your campaign, lead and CRM data and answers questions in plain language; Atlas agents watch the data and send daily or weekly reports to email, Slack or WhatsApp.
From the Scale plan, clicks, conversions and leads stream into your own BigQuery dataset, attributed, so Looker Studio, Power BI and Tableau report on the same numbers LeadJourney shows. Snowflake is on the roadmap.
From signup to live tracking in under 21 minutes, self-serve; an onboarding call with a tracking expert from Starter, and 14 days of setup support.
Case studies
One measured result per customer, with the person, the role and the company behind it.
Tax and accounting
54% better lead quality after using LeadJourney for marketing
Karsten Guhr
Managing Director
Read the story

SEO agency
€500k MRR reached profitably, scaling an SEO agency on performance marketing
Nikita Yatsun
Managing Director
Read the story
Klickkraft GmbH
Business coaching
€10-20k in monthly Meta spend, tied to qualified leads and revenue per ad
Florian Buck
Managing Director
Read the story

LinkedIn growth agency
2x customer retention, once every LinkedIn touchpoint was tracked to revenue
Marc Richard
CEO
Read the story

Digital publishing
Which article produced the lead and the revenue, across AI and organic search
Andreas Malkow
CEO & Head of PR
Read the story

SEO and GEO agency
Proven ROI on every retainer, from organic and AI search leads through to revenue
Philipp Nessmann
Managing Director
Read the story
Getreach
Backlinks marketplace (SaaS)
Switching
Nothing to export by hand. Add the script, connect the accounts, and run both tools for a week or two until the numbers agree.
Paste one snippet into your site or your GTM container, alongside the tags that feed your Databox sources today. It starts recording sessions, click IDs and form fills immediately, and nothing about your current setup changes.
Connect Meta, Google, LinkedIn, Microsoft, Reddit, X, Taboola and Outbrain Ads (a sign-in for most, API credentials for Taboola and Outbrain), then connect the CRM where your deals live. Historic campaign data and spend are imported for you.
The standard reports are there the moment data arrives: channels, campaigns, landing pages, conversion paths and the journey of every lead. For anything else, ask Atlas in plain language or build the report yourself from raw data, then save it as a dashboard.
Original reviews
4.9 out of 5 across 11 public reviews. Quoted as they were left, shortened only by dropping whole sentences.
“Before LeadJourney, we had no reliable tracking concept for our five-figure ad spend. We were manually building spreadsheet and CRM reports, inaccurate and time-consuming. Within two days, everything was set up. For the first time, I know exactly what I pay per lead and which campaigns actually bring in the best-qualified prospects.”
 Florian BuckCEO, Klickkraft GmbH
“With LeadJourney we are able to track all our leads and connect them with sales and attribution data to make better decisions. In the first month of using it we scaled from 0 to 100k revenue from paid ads only.”
 GetreachBacklinks Marketplace (SaaS)
“LeadJourney finally fixed my Marketing Analytics. It goes way beyond basic Ad Tracking Software. The Customer Journey Report saves hours of digging, and capturing everything from Offline Conversions to AI Search Tracking makes it the Best B2B Attribution Platform available.”
“Connected LeadJourney for 2 clients, setup took literally 20 minutes each. The data became more accurate, the reports actually make sense. Now clients look at the dashboard and the 'why don't the numbers match?' questions are gone.”
 Alexander SamarPerformance Marketing Agency
“With LeadJourney, we have finally found a tool that provides us with the data we need to scale our performance marketing campaigns. The most important KPI is no longer lead price but cost per qualified lead.”
 Steffen SiesingCEO, Bilanzmanufaktur GmbH
“The ability to track both online and offline conversions in one unified dashboard has given us insights we never had before. Our ROI has improved dramatically since we started integrating LeadJourney with our CRM. We're finally able to see the full customer journey, and it's been a game changer for our strategy.”
 Andre WitzelFounder, Trading.de
“The ability to seamlessly integrate data from multiple channels and see real-time insights has significantly improved our campaign results. We now focus on metrics that truly matter, like ROI and qualified leads.”
 Nikita YatsunCEO, RLV Media GmbH
Read the reviews where they were left
FAQ
The questions marketing teams ask before choosing between a KPI dashboard and an attribution platform, answered the way we answer them on calls.
Databox is a KPI dashboard: it connects to 130+ tools, shows their numbers on shared dashboards and scorecards, tracks goals against them and sends alerts. Every number on it was produced by a connected source. LeadJourney is an all-in-one attribution platform: it tracks on your own domain server-side, syncs spend from the ad platforms, follows the lead through the CRM stages to the closed deal, tracks the shop order through the Shopify integration or a manually connected shop, records calls with static and dynamic numbers as an add-on, attributes that revenue with every model including AI search as a source, sends stage changes back to Meta, Google, LinkedIn, Microsoft, Reddit, X, Taboola and Outbrain Ads, and reports on all of it with Atlas. Databox shows the KPI; LeadJourney is where the marketing KPI comes from.
No, and it does not try to. Databox's breadth is the point of Databox: finance, product, support and marketing numbers on one scorecard, with up to 10 users on Team Scale and unlimited users on Agency. LeadJourney covers the marketing part properly instead of broadly. It records the click and the conversion itself, needs only the ad platforms for spend, the organic and AI sources for the visit, the CRM for the stages and the revenue, the Shopify integration or a manually connected shop for the orders, and a webhook for the rest, and joins them per lead. That join, cost per qualified lead and revenue per channel, is the KPI a Databox source cannot report, because none of them knows which click made the deal.
Both publish their prices. Databox has a free plan, then Analyst at $71, Team Core at $199, Team Scale at $319 and Agency from $79 a month billed annually ($89, $249, $399 and $99 monthly), with more data sources meaning a higher plan, client packs at $20 each on Agency and a Custom tier on quote, all in US dollars. LeadJourney prices by marketing spend: €129 a month up to €5,000 of spend, €249 up to €15,000, €499 up to €50,000, €799 up to €100,000 and from €999 above that, monthly or yearly, with tracking and attribution included, after a 14-day trial without a card.
Yes, and that is the usual arrangement. Databox keeps the company-wide scorecard; LeadJourney supplies the marketing numbers it should show. There is no native Databox connector for LeadJourney, but Databox's own REST API accepts metrics from any source, and LeadJourney's API and Zapier app can push cost per qualified lead and revenue per channel onto the scorecard on a schedule. A data team reaches the same data through the API, webhooks and the MCP connection, or streams it into its own BigQuery dataset with the warehouse export. Most teams then retire the ad platform tiles that disagreed with each other.
Genie answers questions and writes performance summaries on the metrics Databox has collected, drawing on 50 to 1,000 AI credits a month depending on the plan. Atlas answers questions about your campaigns, leads and CRM revenue across everything LeadJourney tracks itself, so it can say which campaign produced the deals that closed last month, not only how a metric moved. Atlas agents watch the data on their own and send daily or weekly reports to email, Slack or WhatsApp. The same data is open to Claude, ChatGPT or Cursor over MCP, as Databox's MCP server opens its metrics.
Not from what its pricing page lists. Databox connects HubSpot, Salesforce and Pipedrive as data sources, so deal counts and pipeline value sit on the dashboard next to the ad spend, but each source reports its own numbers and nothing on the feature list joins a deal to the click that started it. LeadJourney records that click on your domain, follows the lead through the CRM stages to the closed deal, attributes the revenue with every model, and sends the deal back to the ad platforms as an offline conversion so they optimise on it. That is the row the two tools differ on most.
Keep comparing
The comparisons readers of this page open next. Each one says what the other tool does well and who should pick which.

Looker Studio visualises data you still have to assemble and maintain yourself. LeadJourney is a complete tracking, attribution and reporting platform that delivers the insights, not just the charts.
Read the comparison
Whatagraph turns ad and analytics data into white-label client reports and dashboards. LeadJourney tracks and attributes the leads behind those numbers, with client workspaces and Atlas reports built in.
Read the comparison
AgencyAnalytics gives agencies white-label client dashboards over 80 marketing integrations. LeadJourney is the attribution layer under the dashboard: which campaign produced the lead, the call and the closed deal.
Read the comparisonDatabox alternative
Tracking, attribution, CRM revenue and reporting in one platform, GDPR-native, public tiers by spend and live in 21 minutes with the KPI already on the dashboard. Book a demo and see the difference on your own funnel.