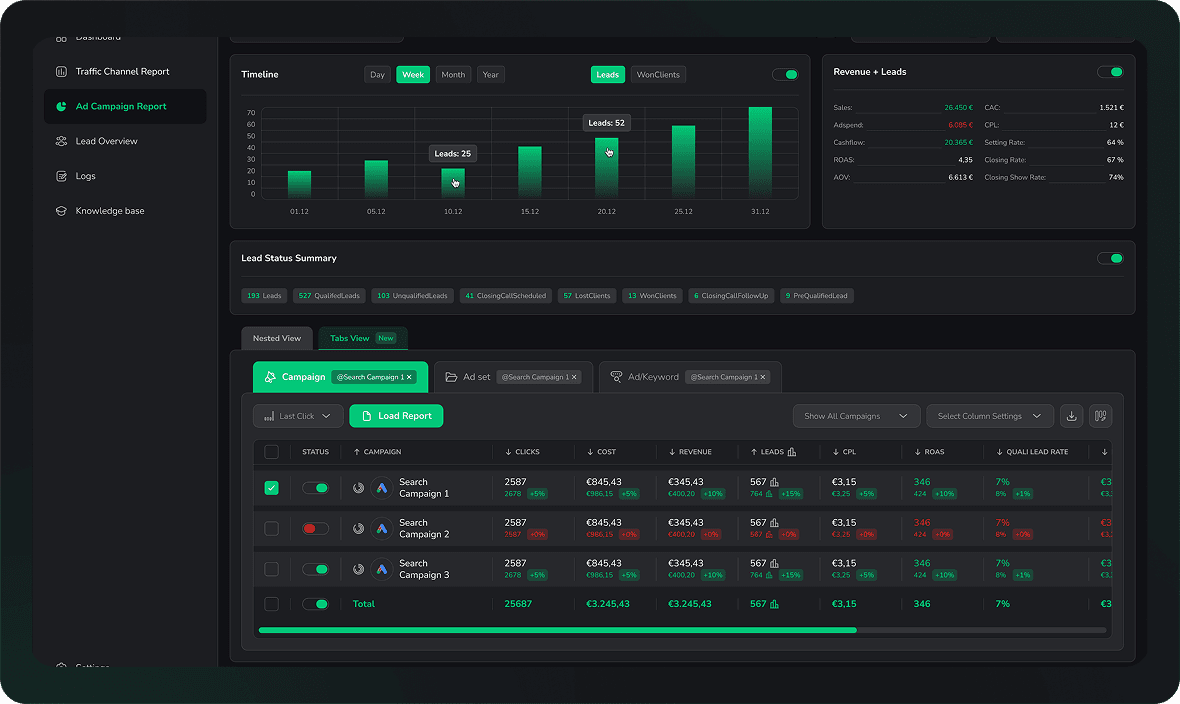















Marketing Efficiency Ratio (MER)
Total revenue divided by total marketing spend over the same period, across every channel at once. The blended return that does not depend on any attribution model.

Summarise this article with AI
Opens the page with a ready prompt in:


Nothing is sent until you pick a service.
In short
Marketing efficiency ratio (MER) is total revenue divided by total marketing spend for the same period, across every channel together. Where return on ad spend asks what one campaign returned, MER asks what all of marketing returned, and it needs no attribution model to answer, because it never tries to say which channel earned what.
It became popular when platform attribution got less reliable after iOS 14: a blended number cannot be fooled by a pixel that stopped firing. Its weakness is the mirror image. MER tells you the whole is working or not, and nothing about which part.
How to Calculate MER
€480,000 of revenue in a quarter ÷ €96,000 of marketing spend = an MER of 5.0.
Revenue means all revenue in the period, including customers who came through organic search, referrals or repeat purchases. Spend means everything marketing cost: ad budgets, agency fees, tooling, sometimes salaries. The wider the definitions, the more honest the ratio and the less it says about any single decision.
MER vs. ROAS
MER is blended
One number for the whole business. It cannot be inflated by a platform claiming a conversion another platform also claimed.
ROAS is per channel
Revenue attributed to one campaign or platform over its spend. It depends entirely on which attribution model did the attributing.
They answer different questions
MER: is marketing paying for itself this quarter? ROAS: should this campaign get more budget next week? A team needs both, and only one of them needs attribution.
A common pattern is a rising platform ROAS beside a falling MER. Each platform reports a better return while the business earns less per euro, because the platforms are each taking credit for the same customers. That gap is the case for attribution on CRM revenue, where one deal is credited once.
What MER Is Good For
- A sanity check on attributionIf the sum of attributed revenue across channels is far above total revenue, the models are double counting. MER is the ceiling.
- Board-level reportingOne ratio a finance team can reproduce from the ledger, with no model to defend.
- Long sales cyclesFor a business whose deals close months after the click, a quarterly MER is often more stable than any weekly channel figure.
Where MER Falls Short
- It cannot tell you which channel to cut or scale. A falling MER with five channels running gives you five suspects.
- It lags. Revenue arrives after the spend, so a quarter's MER reflects last quarter's marketing as much as this one's.
- It rewards cutting. Reduce spend and MER rises for a while as pipeline built earlier keeps closing, which hides the damage until it is done.
- It mixes marketing revenue with everything else. Referrals and renewals lift MER without any campaign having earned them.
The practical setup is MER as the guardrail and per-channel revenue from marketing reporting software as the steering wheel. The ROAS calculator shows the break-even ratio for a given margin, which is the line the blended number must stay above.
Conclusion
MER is the one marketing return nobody can argue with, and the one that decides nothing on its own. Use it to check that the attributed numbers add up and that marketing as a whole clears its break-even, then use attribution on CRM revenue to decide where the next euro goes.
Keep exploring
Related glossary terms
Return on Ad Spend (ROAS)
Revenue generated by advertising divided by the amount spent on it, written as a multiple (4x) or a percentage (400%). The number every platform reports, and the one whose meaning depends entirely on where the revenue figure came from.
Read the definition6 min read
Customer Acquisition Cost (CAC)
The total sales and marketing cost of winning one new customer: everything spent on acquisition in a period divided by the customers gained in it. The cost that CPL and CPA lead up to.
Read the definition6 min read
Cost Per Acquisition (CPA)
Advertising spend divided by the number of conversions it produced. Which action counts as the acquisition decides whether the number means anything.
Read the definition5 min read
95%+ data accuracy, even with ad blockers and iOS
See which ads really created your
Connect your ad accounts and your CRM once, and every lead arrives with the campaign that created it already attached.